
Figure 4. Characterization of the dimerization interface of NADK2.
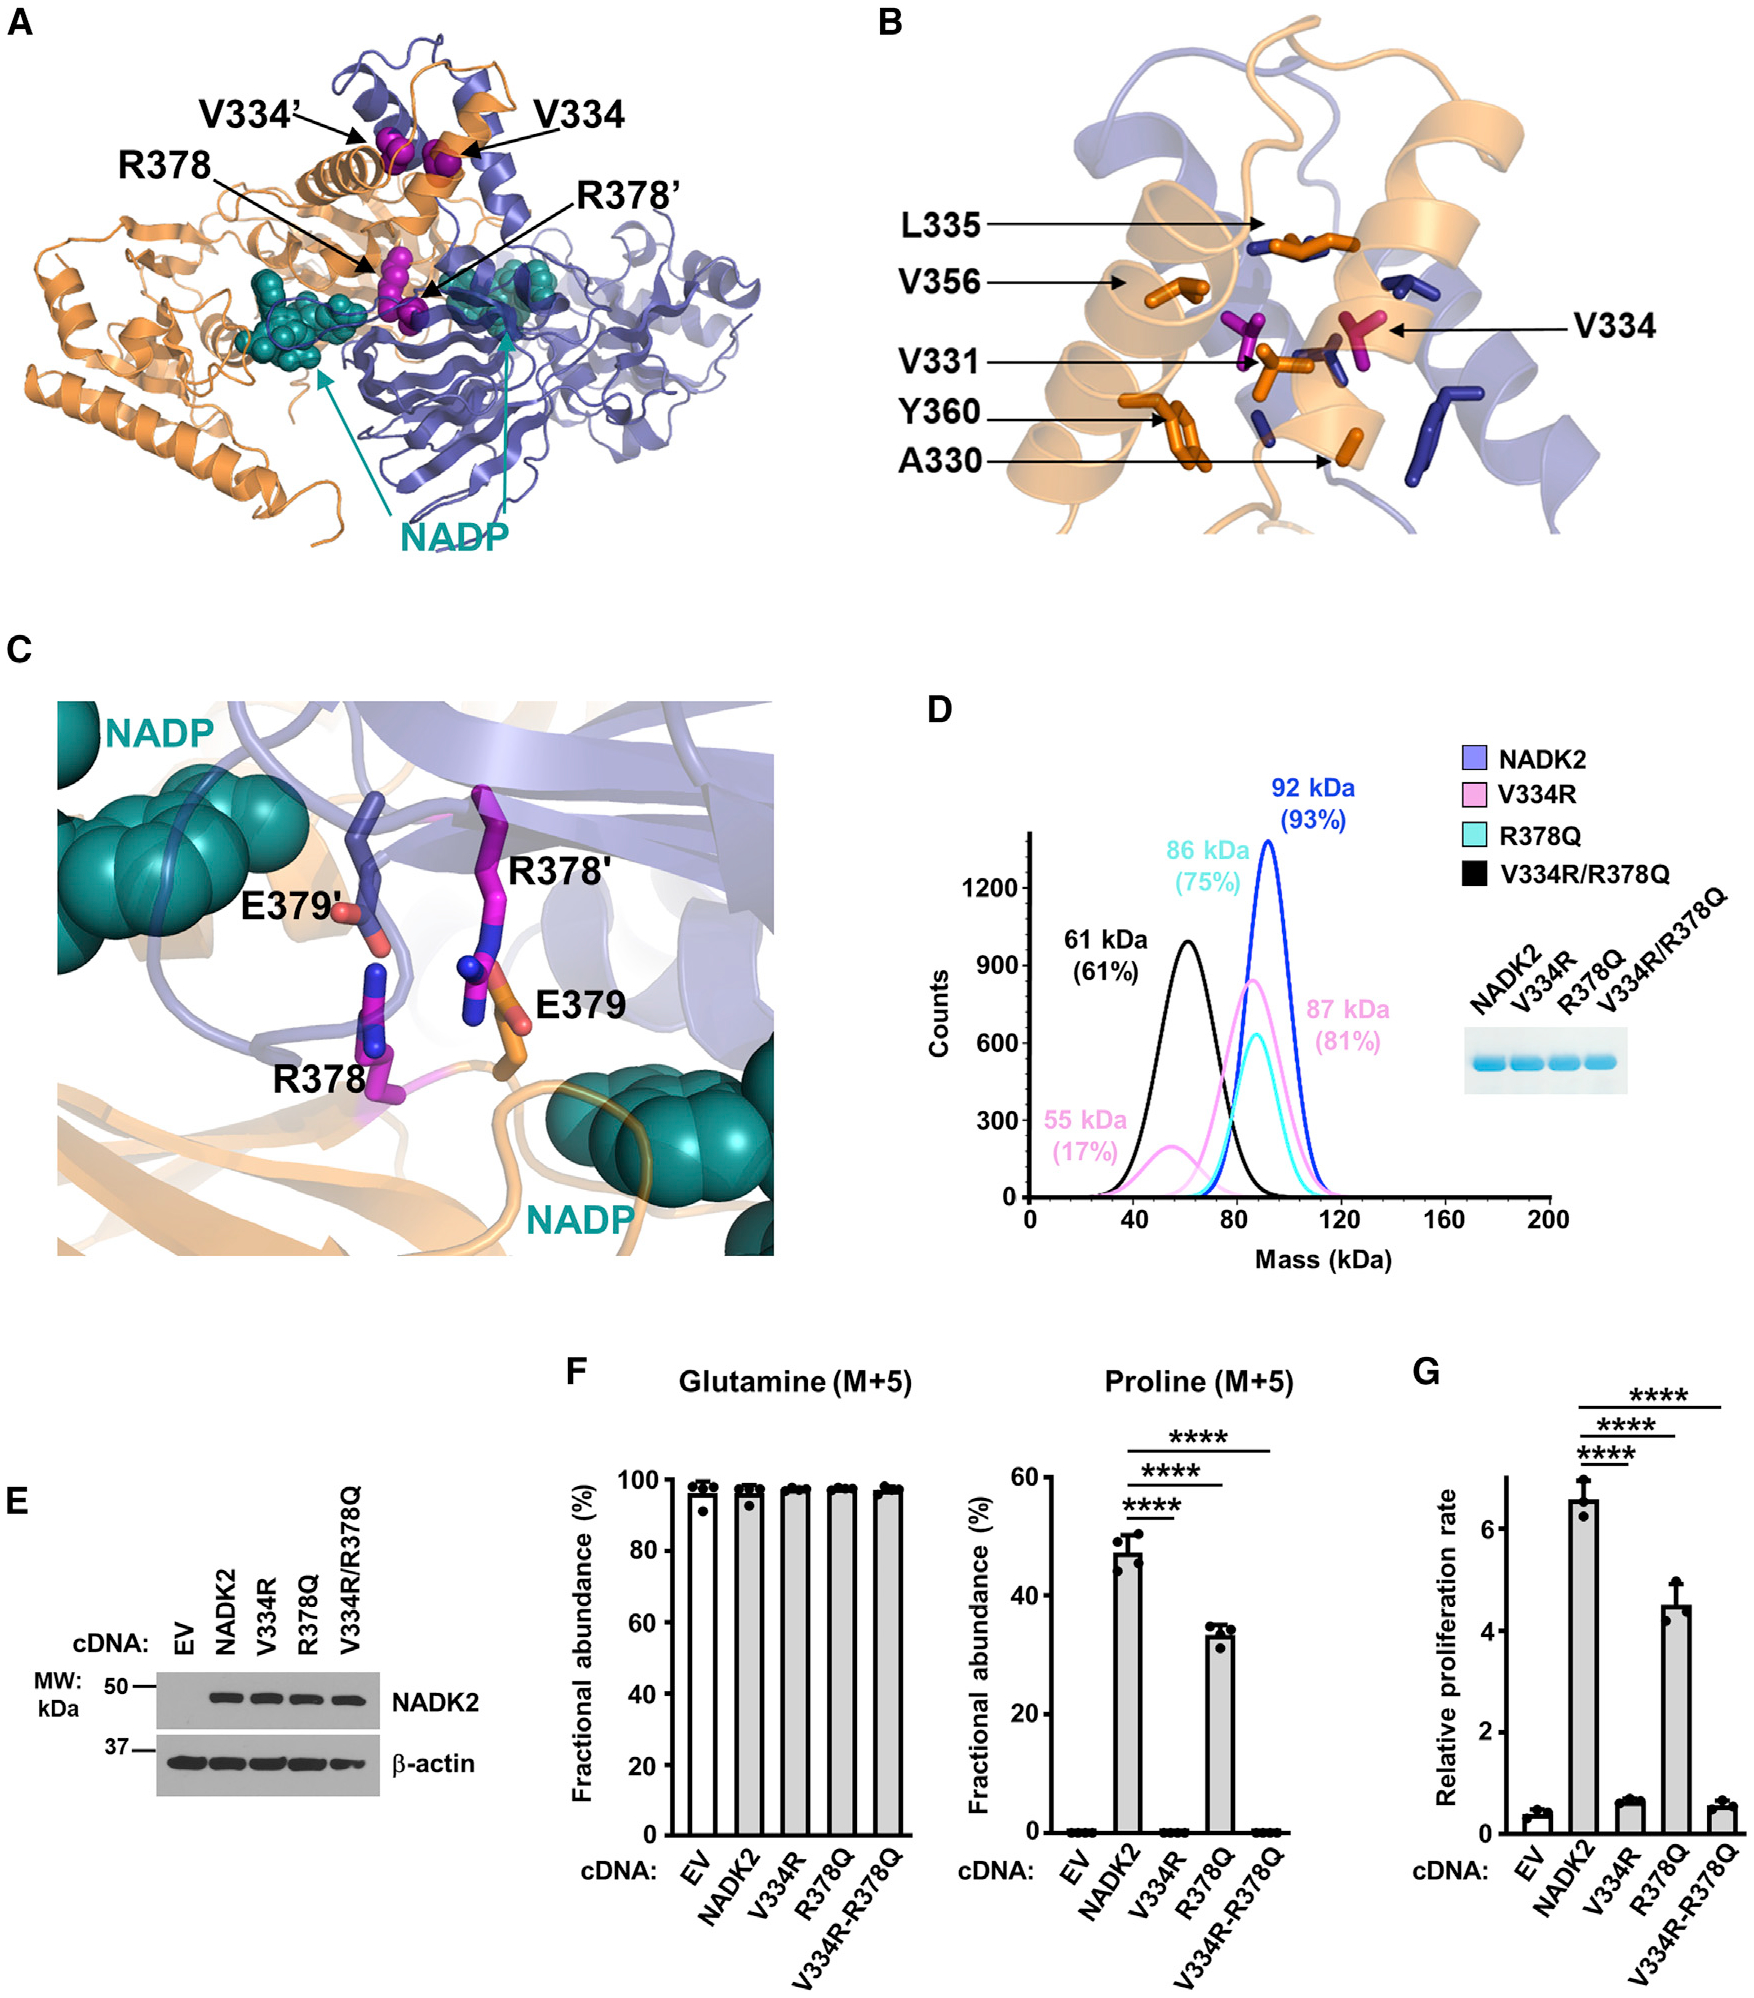
(A) Crystal structure of the dimeric NADK2 highlighting the position of two V334 and R378 residues at the dimerization interface. Monomers are shown in ribbon as in Figure 1A. The mutated residues are in pink spheres, and the NADP+ is in deep cyan spheres.
(B) Zoom in the crystal structure of the NADK2 highlighting the structural role of V334. The surrounding hydrophobic residues (A330, V331, L335, V356, and Y360) that directly interact with V334 are shown. Only one monomer is labeled for clarity.
(C) Zoom in the crystal structure of the NADK2 highlighting the structural role of R378. The two monomers are shown as orange and blue ribbons. The R378 and its interacting neighbor E379′ (from a second monomer) are shown in stick (colored as the monomer they belong to). The nicotinamide group of NADP+ is shown in a deep cyan sphere and labeled as in B.
(D) Mass photometry of recombinant His-NADK2 or the indicated variants purified from E. coli, showing that His-NADK2V334R/R378Q exists in a monomeric state (calculated MW = 61 kDa for 61% of the sample), while His-NADK2 or His-NADK2 R378Q are dimeric. His-NADK2V334R showed two pools corresponding to molecular weights of its monomeric and dimeric forms. Coomassie blue of purified NADK2 variants is shown on the right.
(E) Immunoblots from ΔNADK2 HEK293E cells stably expressing either empty vector, NADK2 WT, or the indicated NADK2 variants (V334R, R378Q, and V334R/R378Q).
(F) Fractional abundance of glutamine (M+5) and proline (M+5) from ΔNADK2 HEK293E cells stably expressing either empty vector (EV), NADK2 WT, or NADK2 variants (V334R, R378Q, and V334R/R378Q) labeled for 3 h with 13C5 glutamine.
(G) Relative cell proliferation of ΔNADK2 HEK293E cells stably expressing either empty vector, NADK2 WT, or the indicated NADK2 variants. Cells were grown for 72 h in 10% dialyzed serum in the absence of proline.
Data are presented as the mean ± SD from n = 3 (G) or n = 4 (F) of biologically independent samples, and data are representative of at least two independent experiments. (F and G) ****p < 0.001 for multiple comparisons calculated using one-way ANOVA and Tukey’s post hoc test.