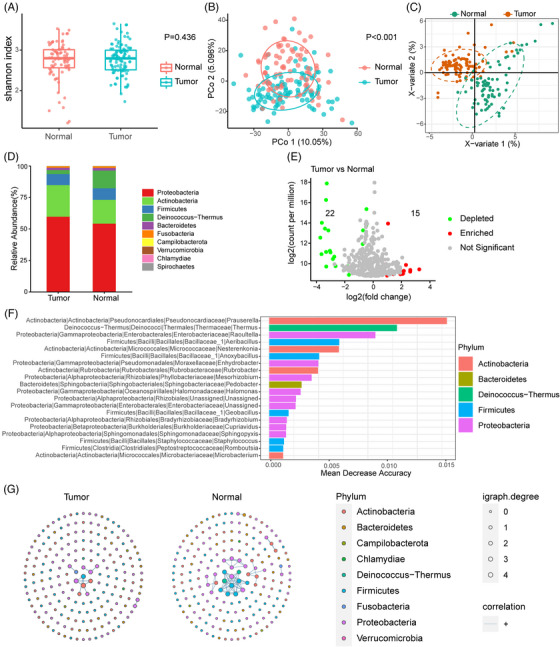
FIGURE 2.

Characterisation of the microbiome in hepatocellular carcinoma (HCC) tumour and adjacent normal tissues. (A) Boxplot of Shannon index in the tumour and adjacent normal tissues. (B) Principal coordinates analysis (PCoA) based on Manhattan distance of the tumour and adjacent normal tissues. (C) Partial least squares discriminant analysis (PLS‐DA) of the tumour and adjacent normal tissues. (D) Bar plots of microbial composition at the phylum level in tumour and normal tissues. (E) Volcano plot of differential amplicon sequence variants (ASVs) between tumour and normal groups. ASVs significantly depleted in tumour tissues are shown in green; those significantly enriched in tumour tissues are shown in red (|log2 fold‐change| > 1, p < .05, and FDR < 0.2). (F) Bar plot of 20 genera with the top ability to discriminate tumour from normal tissues computed from a random forest model. The phyla are indicated by different colours. (G) Microbial networks in tumour and normal tissues. Each dot represents one ASV, and only 200 ASVs with top abundance are shown. The size of each dot represents igraph degree, which reflects the number of significant correlations between the corresponding ASV with the others. Blue lines indicate positive correlations.
