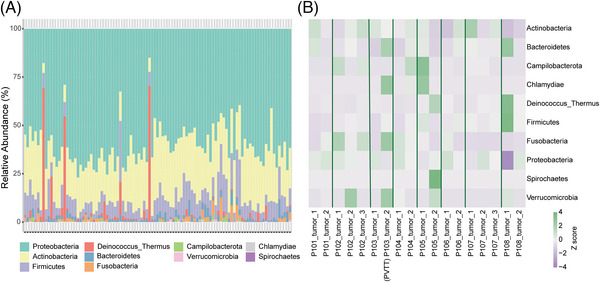
FIGURE 3.

Heterogeneities between individuals or multiple tumour lesions of the microbiome in hepatocellular carcinoma. (A) Stacked column bar graph depicting within‐cohort microbial composition at the phylum level. (B) Heatmap showing the heterogeneity between multiple tumour lesions of patients with multiple tumour samples available. The relative abundance of each phylum is scaled according to the row.
