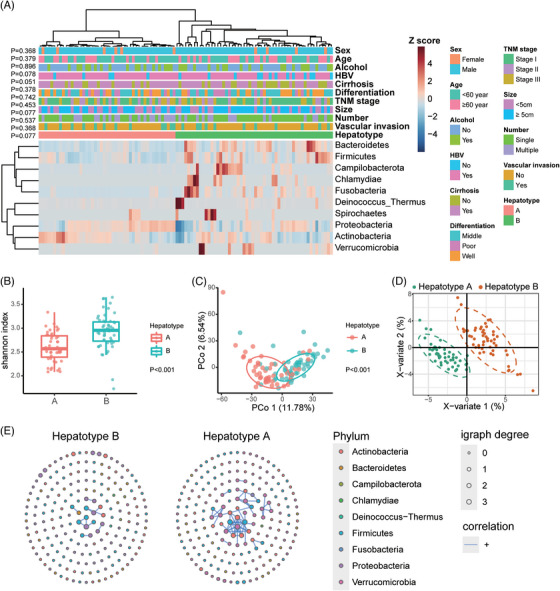
FIGURE 5.

Clustering analysis and characterisation of the microbiome in the two Hepatotypes. (A) Clustering heatmap highlights the microbial signature of hepatotypes A and B, revealing the correlation between the hepatotype and clinical characteristics. The clustering analysis was conducted on the relative abundance of each phylum, which was scaled across all the tumour samples. Z scores were calculated and presented in the heatmap. (B) The α‐diversity of tumour samples belonging to Hepatotypes A and B. (C) Principal coordinates analysis (PCoA) based on Manhattan distance of the Hepatotypes A and B. (D) Partial least squares discriminant analysis (PLS‐DA) of the hepatotypes A and B. (E) Microbial networks in hepatotypes A and B. Each dot represents one ASV, and only 200 ASVs with top abundance are shown. The size of each dot represents igraph degree, which reflects the number of significant correlations between the corresponding ASV with the others. Blue lines indicate positive correlations.
