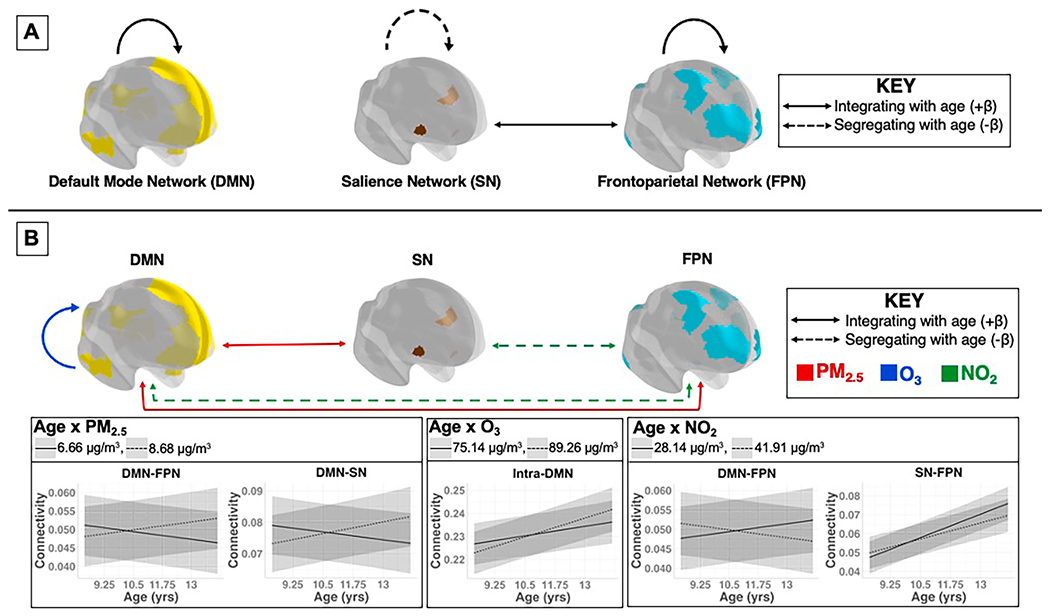
Fig. 1.

A) Longitudinal changes seen with age from 9 to 13 years in large-scaled cortical functional connectivity. B) Significant associations between the age-by-pollutant interaction term and intra- and inter-network rs-fMRI outcomes (FDR corrected). Red lines indicate the age-by-PM2.5 interaction term; blue lines indicate the age-by-O3 interaction term; green lines indicate the age-by-NO2 interaction term. Solid lines represent network integration, or increased functional connectivity as measured by BOLD rs-fMRI; dashed lines represent network segregation, or decreased functional connectivity as measured by BOLD rs-fMRI. For ease of interpretation, graphs depict significant interactions between pollutant and age per intra- and inter-network outcome for both the 0.75 quartile (dashed line) (PM2.5 = 8.68 μg/m3; O3 = 89.26 μg/m3; NO2 = 41.91 μg/m3) and 0.25 quartile (solid lines) (PM2.5 = 6.66 ϋg/m3; O3 = 75.14 μg/m3; NO2 = 28.14 μg/m3) of each pollutant. (For interpretation of the references to colour in this figure legend, the reader is referred to the web version of this article.)
