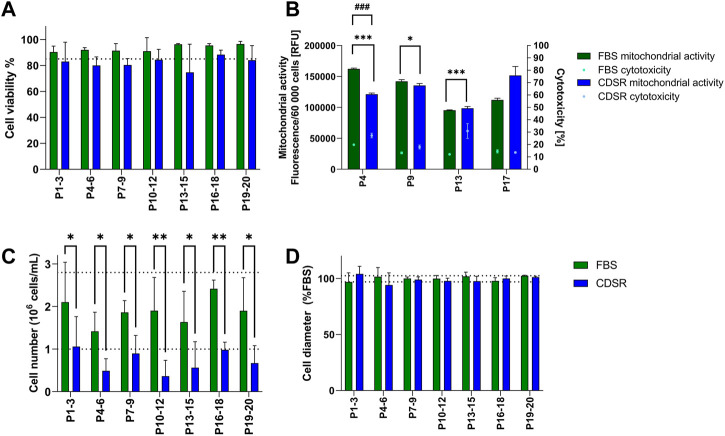
FIGURE 2.
Characterisation of TK6 cell line during direct adaptation to chemically defined serum replacement (CDSR) supplemented media. Cell viability (A), cell count (C), and cell size (D) were measured every cell passage and pooled every three passages and expressed as mean (±SD). Mitochondrial activity (bars) and cytotoxicity (dots) (B) were measured at indicated on x-axis passage number and expressed as mean (±SD). Dotted lines show the highest and/or lowest values of cell viability (A), growth (C), and cell diameter (D) of cells growing in 10% (v/v) FBS-supplemented medium. Significant difference between conditions was analysed by two-way ANOVA. Statistical significance was indicated as follows: for (B): cytotoxicity statistical significance was indicated with *: * indicates p < 0.05 and *** indicate p < 0.001; while mitochondrial activity statistical significance was indicated with #: ### indicate p < 0.05; for (C): * indicates p < 0.05 and ** indicate p < 0.01.

