FIGURE 5.
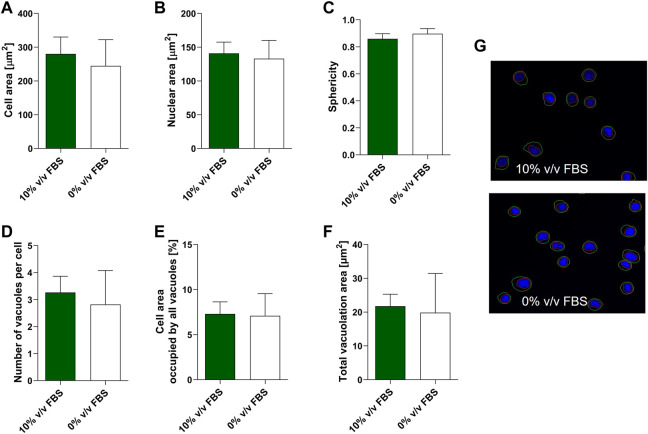
Morphometric characterisation of TK6 cell line cultured in FBS-supplemented medium (green bars) and in CDRS-complemented media (white bars). Cell area (A), nuclear area (B), sphericity (C), number of vacuoles per cell (D), cell area occupied by vacuoles (E) and total vacuolation area (F) were assessed using high content image analysis. Data are expressed as mean (±SD) of n = 3 replicates from two separate experiments on selected passage numbers 35 and 47. Panel (G) shows representative images of TK6 cells (×20 magnification) stained with Hoechst 33,342. Nuclear and cellular segmentations are outlined with red (nucleus) and green (cell) colours.

