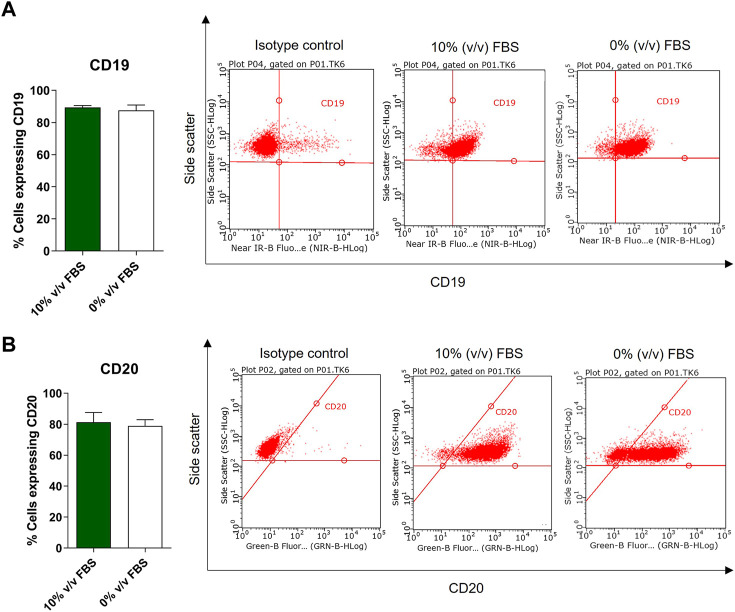
FIGURE 6.
Phenotypic characterisation of TK6 cell line cultured in FBS-supplemented medium (green bars) and in CDRS-complemented media (white bars). CD19 (A) and CD20 (B) surface markers expression was assessed by flow cytometry. Data are expressed as mean (±SD) of n = 3 separate experiments on selected passage numbers 23, 29, and 41.

