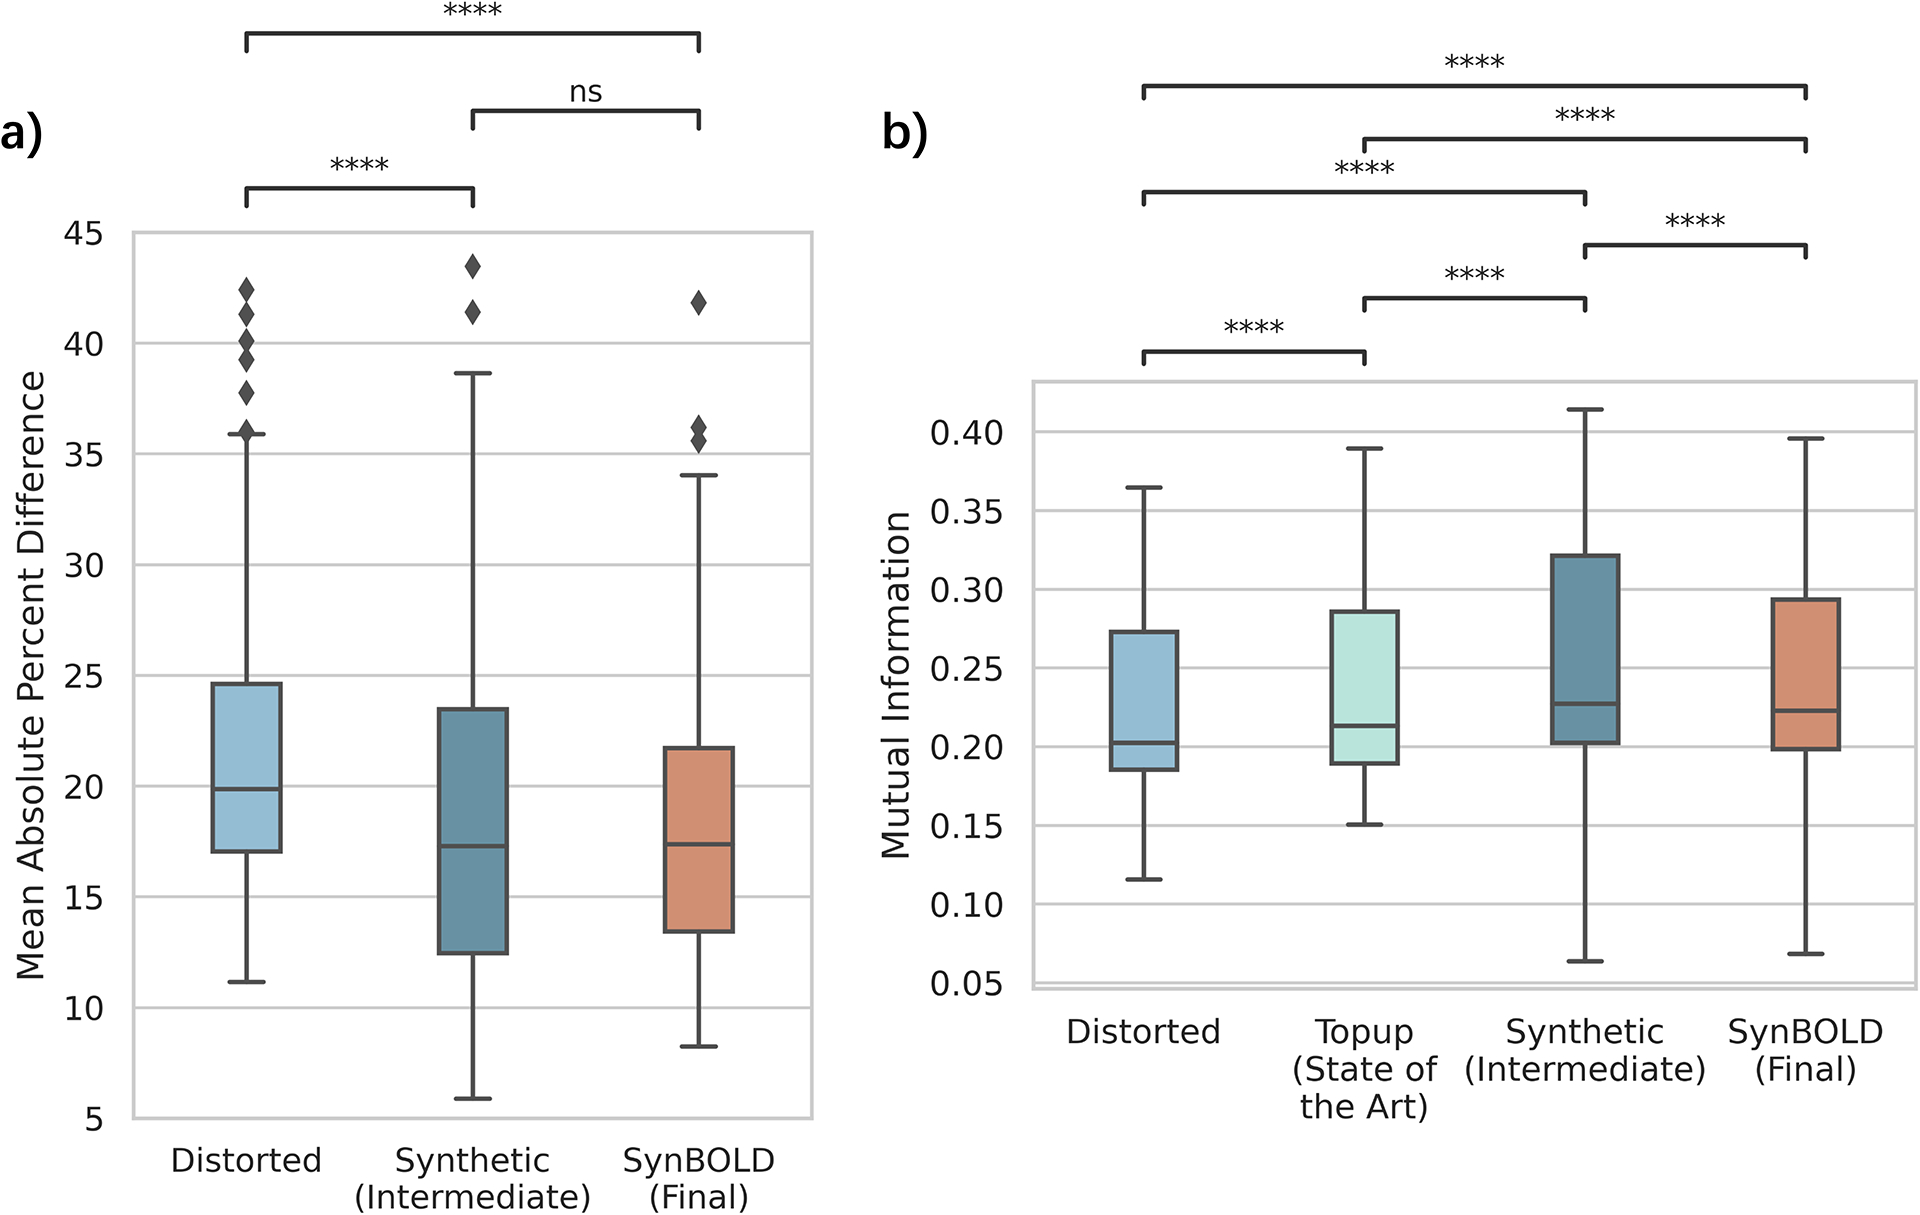
Figure 3.

Quantitative evaluations of pipeline accuracy. (a) Mean percent difference between the “Distorted”, “Synthetic (Intermediate)”, and “SynBOLD (Final)” volumes used in our pipeline and the “Topup (State-of-the-art)” volume. Lower mean percent difference indicates increased similarity with the state-of-the-art. (b) Mutual information between the “Distorted”, “Topup (State-of-the-art)”, “Synthetic (Intermediate)”, and “SynBOLD (Final)” volumes and a corresponding N3 bias corrected T1w MRI. Higher mutual information indicates increased geometric similarity with the structural image. **** p < 0.0001 (Wilcoxon sign rank test with Bonferroni correction), ns = not significant.
