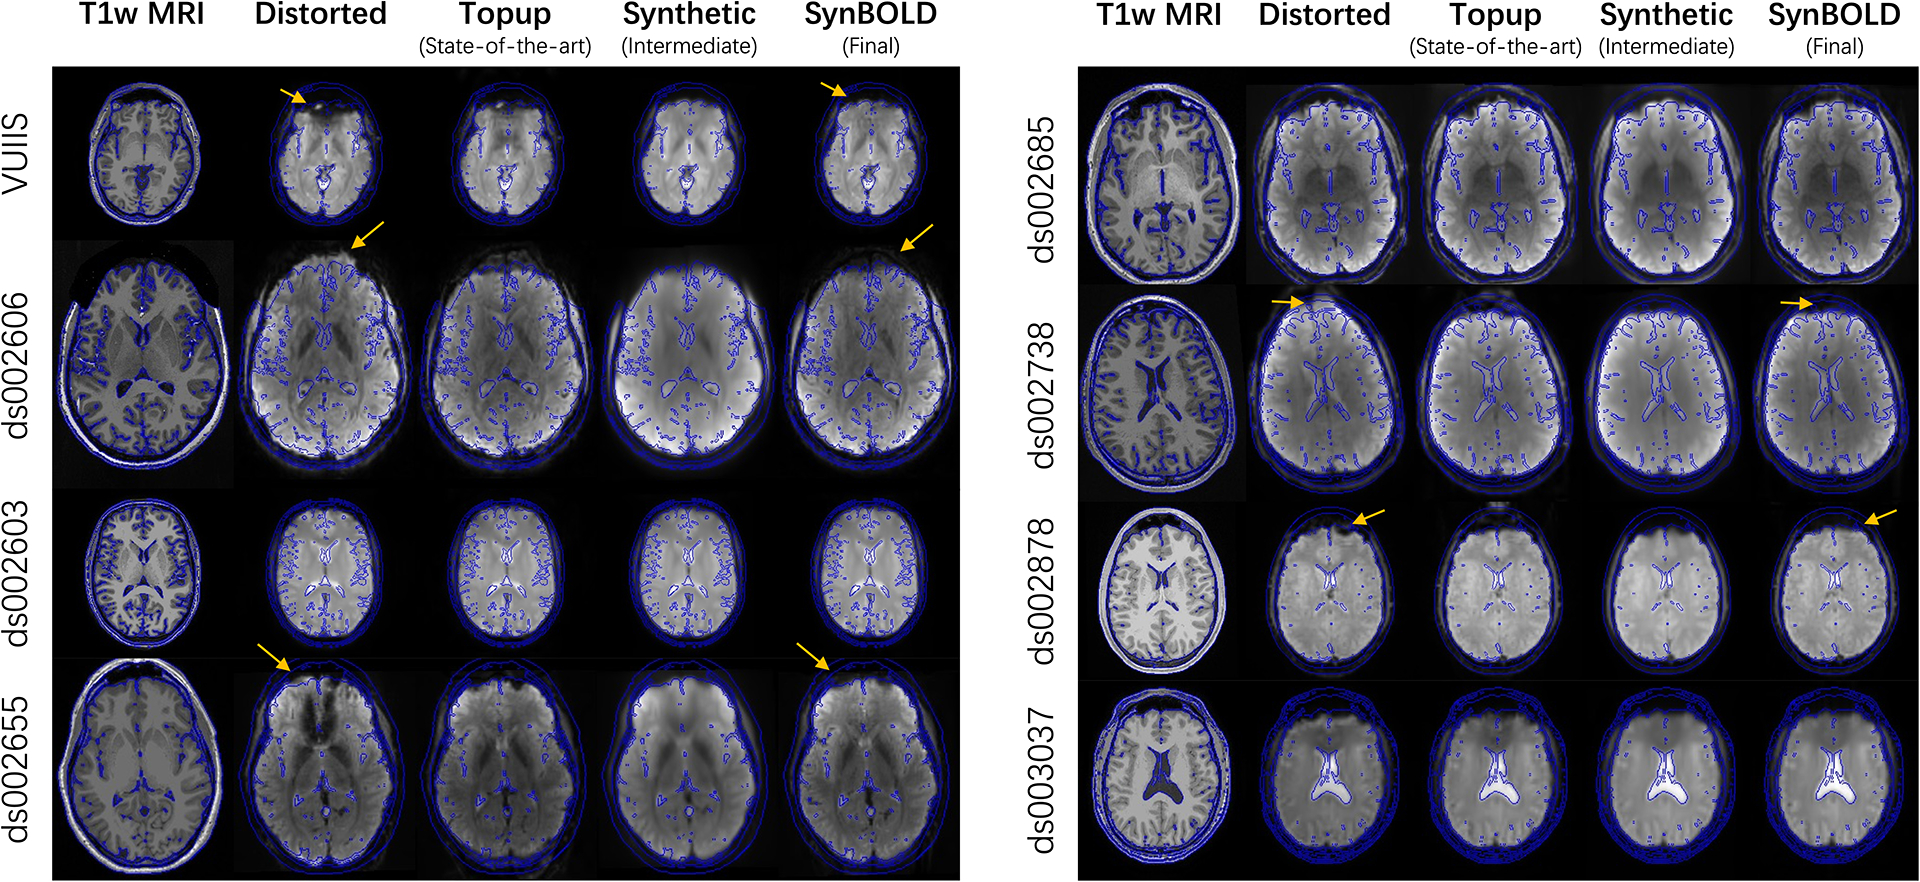
Figure 5.

Visualization of a representative sample from each of the 8 withheld datasets, including the “Distorted”, “Topup (State-of-the-art)”, “Synthetic (Intermediate)”, and “SynBOLD (Final)” volumes and a corresponding structural T1w MRI. Blue lines indicate tissue interfaces computed on the T1w MRI. Yellow arrows denote examples of geometrically improved distortions with our pipeline.
