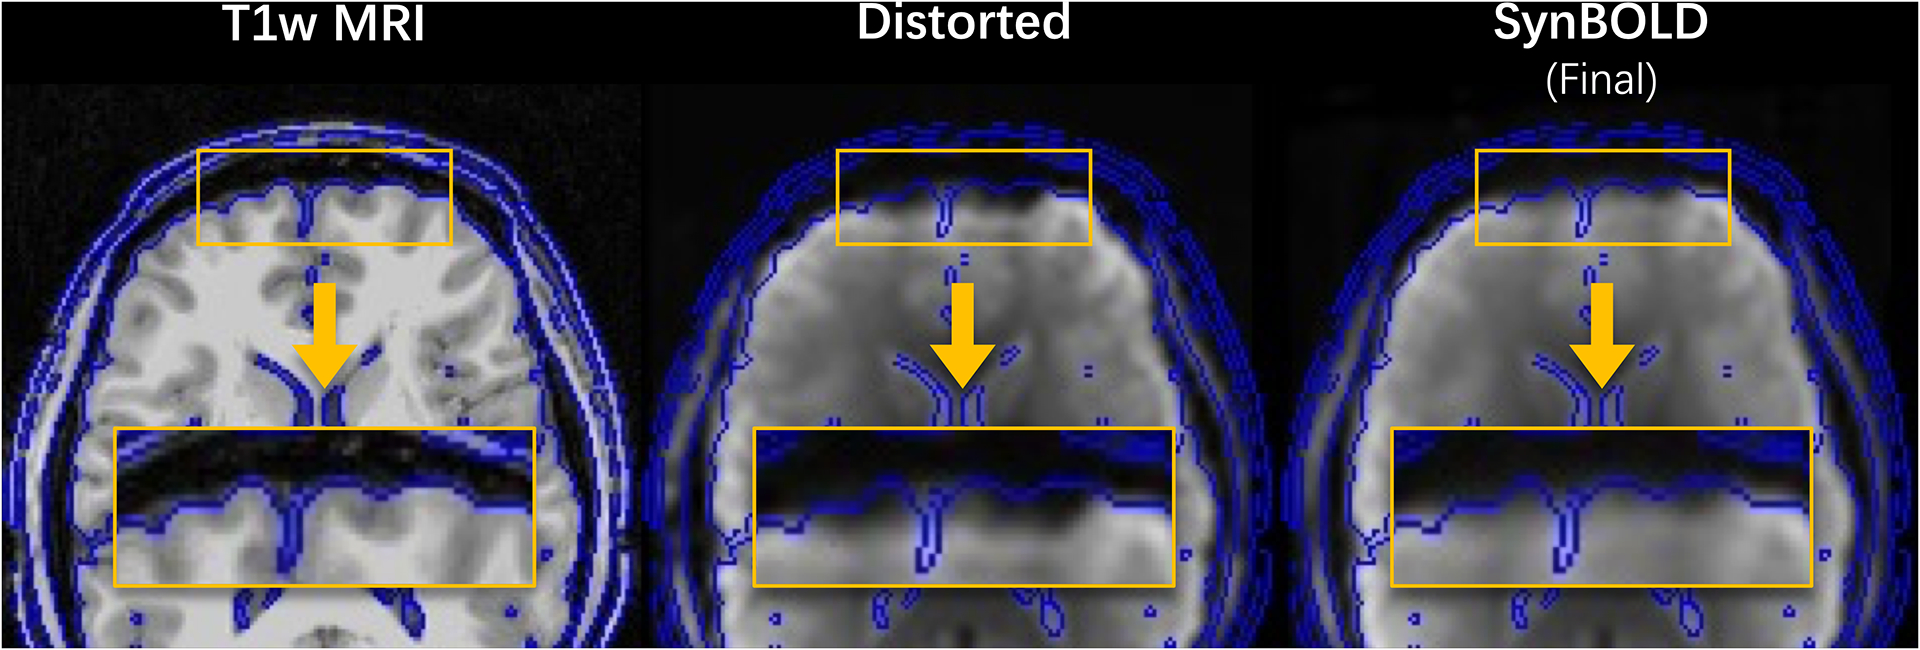
Figure 6.

Visualization of a representative sample in the external validation set, including the “Distorted” input and “SynBOLD (Final)” output of our pipeline as well as a corresponding structural T1w MRI. Blue lines indicate tissue interfaces computed on the T1w MRI. The yellow boxes denote corresponding frontal gyri with improved geometric similarity to T1w MRI after SynBOLD. The “Topup (State-of-the-art)” volume is omitted because these data were acquired without reverse phase encoded images and thus are unable to undergo traditional distortion correction.
