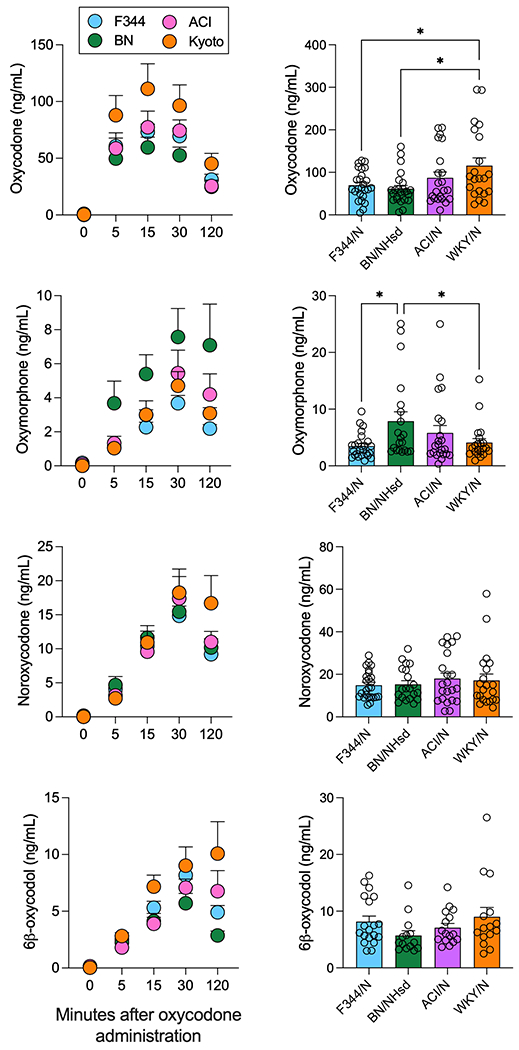
Figure 2.

Pharmacokinetics of oxycodone and three of its major metabolites. Plasma levels (expressed in ng/ml) of oxycodone (panels A, B), oxymorphone (panels C, D), noroxycodone (panels E, F), 6β-oxycodol (panels G, H), shown as a time course after 1 mg/kg intravenous oxycodone administration (panels A, C, E, G) or as peak concentration (Cmax) (panels B, D, F, H). Data for the four strains, F344/N (blue), BN/NHsd (green), ACI/N (pink), and WKY/N (orange), are shown as mean ± S.E.M. * indicate post-hoc tests of p < 0.05
