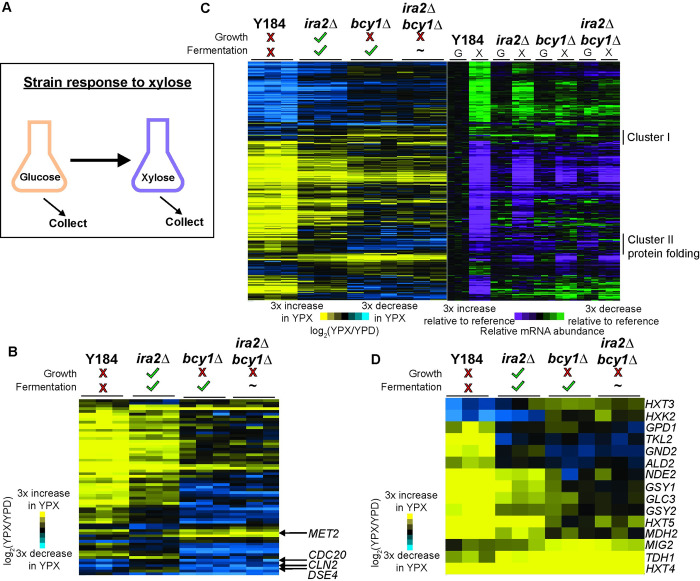
Fig 2. Few transcriptomic patterns correlate with anaerobic xylose growth.
A. Experimental overview. Strains were grown anaerobically in rich glucose medium to early/mid-log phase, then switched to anaerobic rich xylose medium for three hours. B. Expression of 65 genes whose log2(fold change) upon glucose to xylose shift is different (FDR < 0.05) in at least one of the three non-growing strains (Y184, bcy1Δ, ira2Δbcy1Δ) compared to ira2Δ. Genes (rows) were organized by hierarchical clustering across biological triplicates measured for each strain (columns). Genes discussed in the text are annotated on the figure. C. Hierarchical clustering of 292 genes whose log2(fold change) upon glucose to xylose shift is different (FDR < 0.05) between the non-fermenting Y184 strain and the two robustly xylose fermenting strains (ira2Δ, bcy1Δ). The blue-yellow heatmap on the left represents the log2(fold change) in expression upon glucose to xylose shift across biological triplicates (columns). The purple-green heatmap on the right represents the abundance of each transcript (rows) in each strain grown on glucose (G) or xylose (X), relative to the average (n = 3) abundance of that transcript measured in the Y184 YPD sample. Clusters I and II are described in the text. D. Expression of 15 genes from C) that have annotations linked to glycolysis, gluconeogenesis, TCA cycle, and carbohydrate storage.

