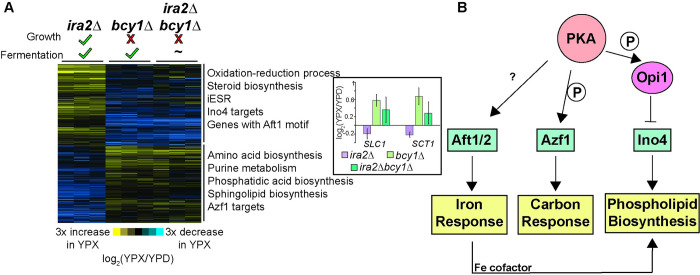
Fig 3. Genes uniquely expressed in the bcy1Δ strain implicate an integrated response to xylose metabolism and growth coupling.
A. Expression of 654 genes whose log2(fold change) upon glucose to xylose shift is different (FDR < 0.05) between the ira2Δ and bcy1Δ strains and whose expression change is in the opposite direction across the two strains (see Methods for details). Significant functional enrichments are annotated next to the two main clusters (p < 10−4, hypergeometric test). Bar graph inset represents the log2(fold change) of the two phosphatidic acid biosynthesis enzymes in this group, see text for details. B. Regulatory relationships between transcription factors whose targets or known binding sites were enriched in (A). Documented PKA-dependent phosphorylation is indicated by a P. See text for details.

