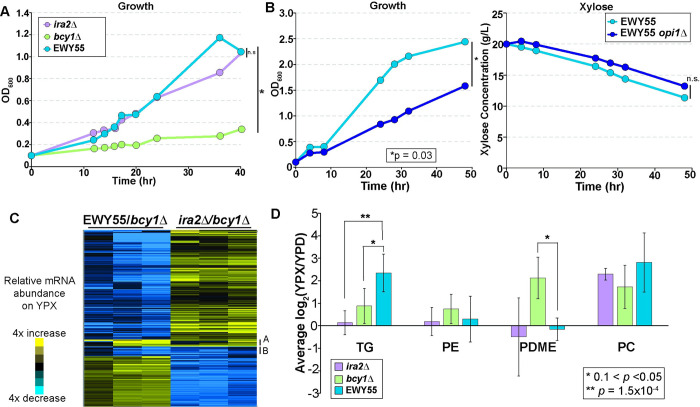
Fig 5. Directed evolution recoupled growth and metabolism on xylose.
A. Average (n = 3) change in OD600 of ira2Δ, bcy1Δ, and EWY55 strains grown anaerobically in rich xylose medium (*, p < 10−4, ANOVA; n.s., not significant). B. Change in OD600 (left panel) and xylose concentration (right panel) over 48 hours of EWY55 and EWY55 opi1Δ strains grown anaerobically on rich xylose medium. (*, p < 0.05, ANOVA). C. Expression of 233 genes whose transcript abundance during growth on xylose was significantly different in EWY55 and/or ira2Δ strains compared to the bcy1Δ strain (FDR < 0.05), visualized by hierarchical clustering. Data represent the log2 transcript abundance in each strain grown anaerobically in xylose compared to bcy1Δ strain. Cluster A (9 genes) and B (13 genes) are annotated, see text for details. D. Bar plot of the average and standard deviation log2(fold change) (n = 3) in lipid abundance of key lipids with reproducible differences 1.5-fold or greater in EWY55 compared to ira2Δ or bcy1Δ strains. Asterisks denote significant differences by ANOVA.

