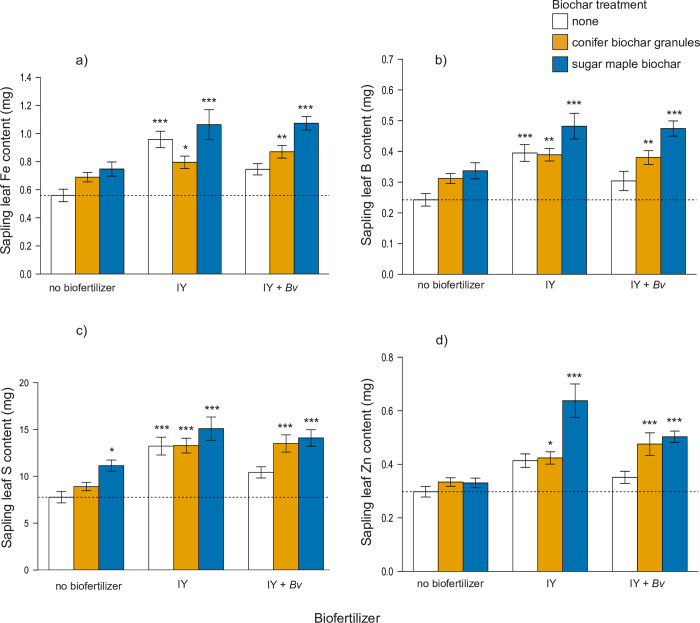
Fig 8.
Final sapling leaf micronutrient content (mg) of: a) iron b) boron, c) sulphur, d) zinc. Statistically significant differences between the control and the treatment groups are indicated by asterisk (1-way ANOVA, Dunnett’s test, * = p < 0.05, ** = p < 0.01, *** = p < 0.001). Dashed line indicates control mean. IY = inactivated yeast, Bv = Bacillus velezensis.

