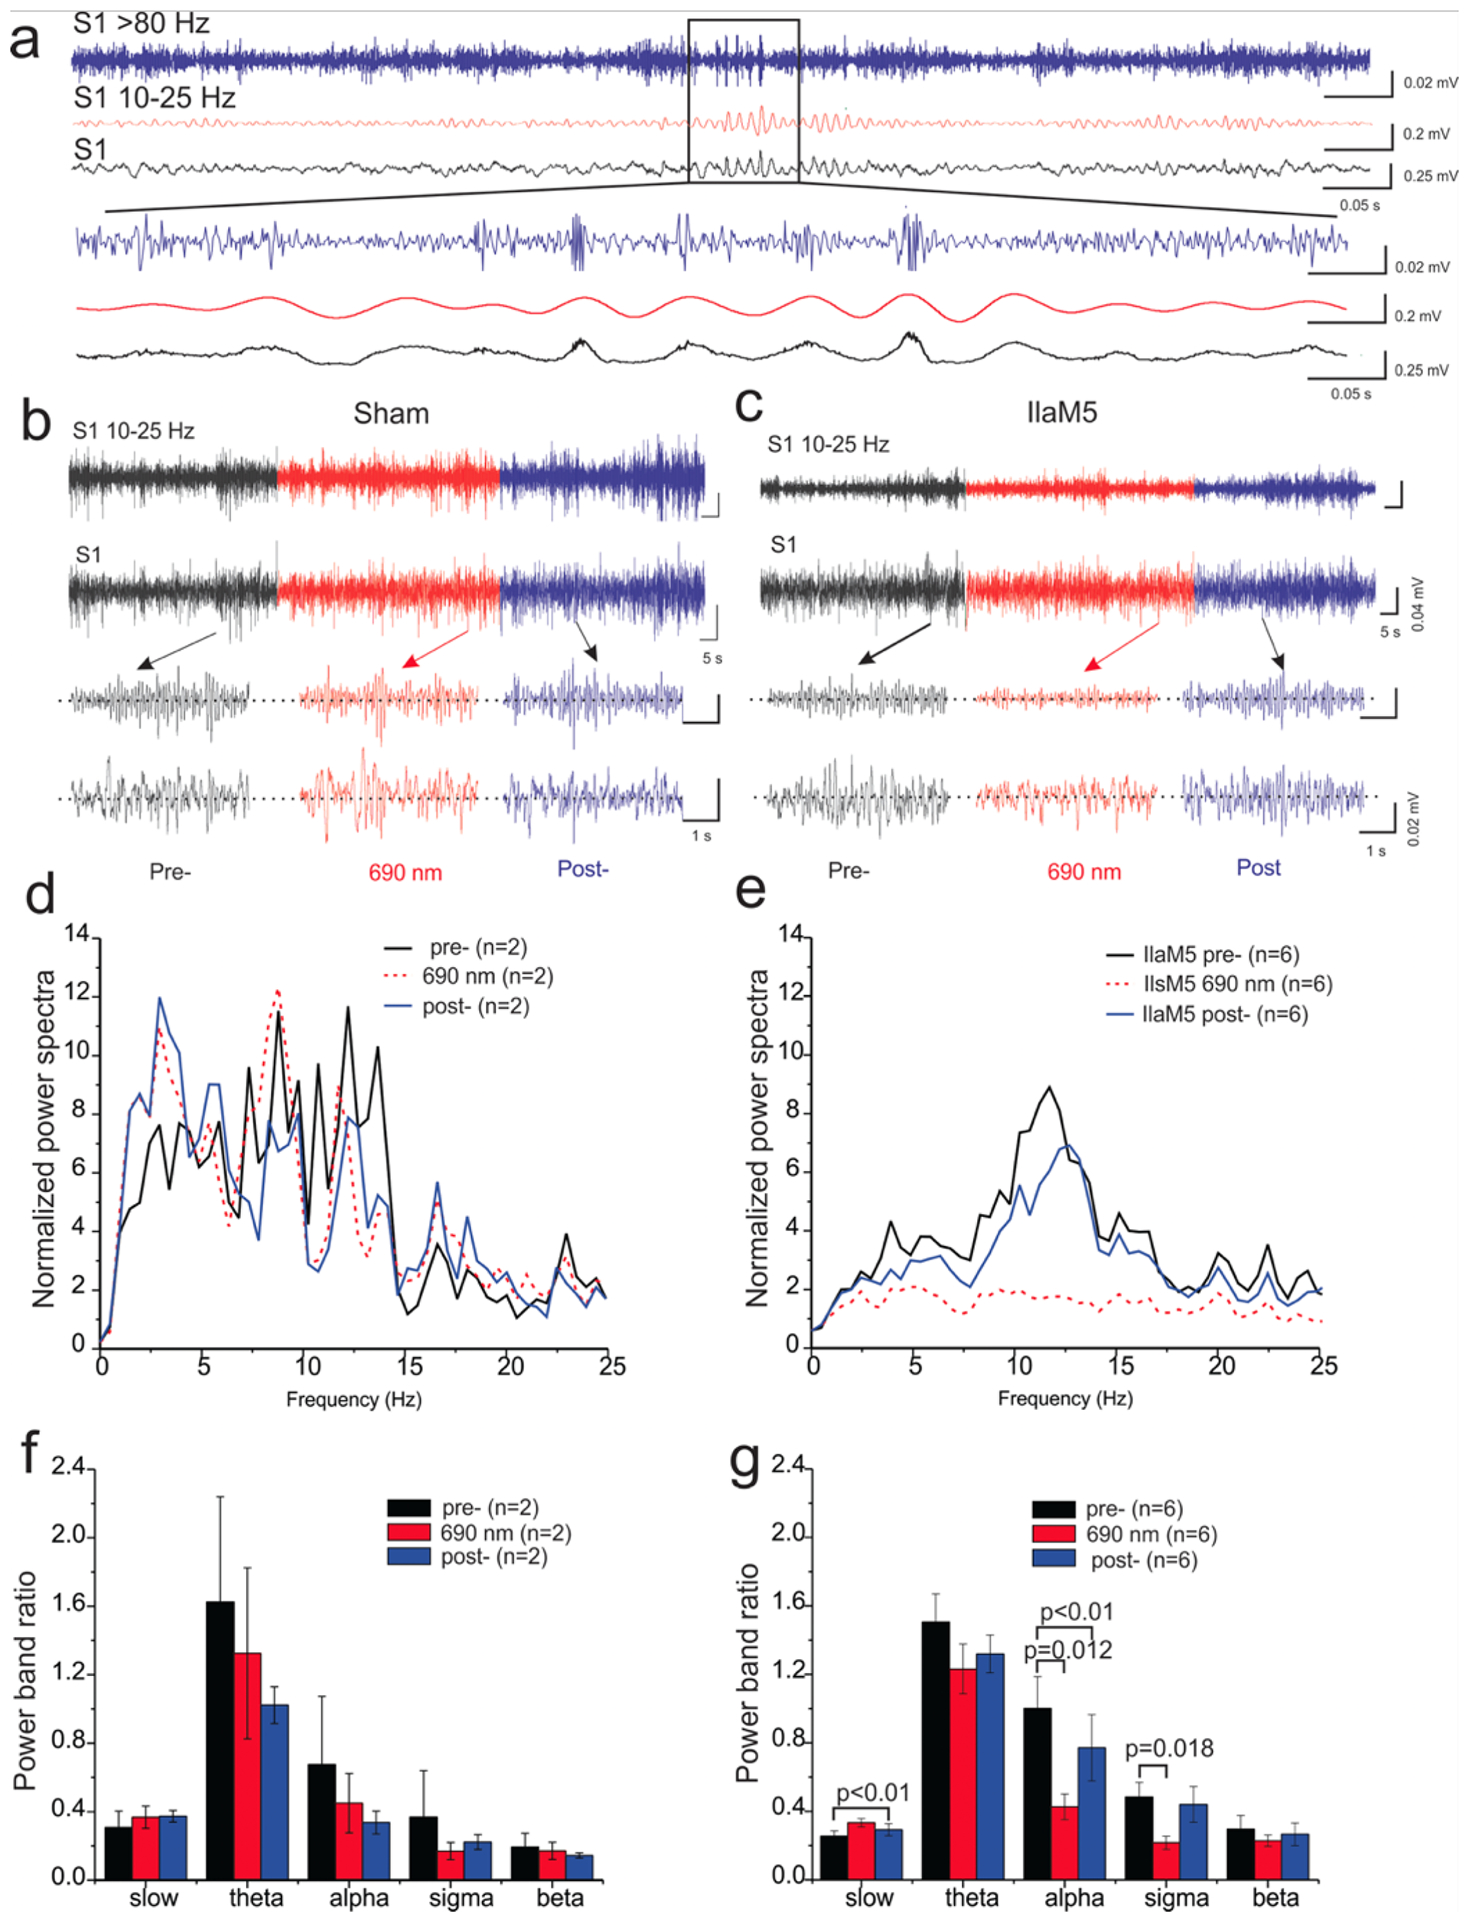
Figure 6. NIRW light-induced suppression of spindle waves in sleeping mice.

(a) EEG recordings of NREMS in S1. (b-e) Representative expanded EEG traces (b, c) and power- spectral of the EEG trace (d, e) pre-, during, and post NIRW irradiation in S1. (f, g) Effects of transcranial NIRW light stimulation via an LED panel on the power-band for spindle waves (10– 15 Hz) recorded in the S1. (b, d, f), sham (empty AAV injected); (c, e, g), IlaM5 expressing mice (AAV::ilaM5 injected).
