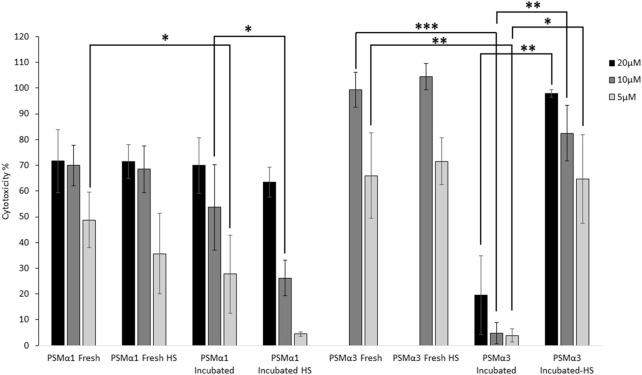
FIGURE 6.
Cytotoxicity of PSMα1 and PSMα3. Cytotoxicity against T cells of both freshly dissolved and incubated PSMα1 and PSMα3, before and after heat shock, was assessed using the lactate dehydrogenase colorimetric assay (LDH). The experiment was done in at least three replicates and repeated three times on different days to ensure the reliability of the results. The percentage of cytotoxicity for each sample was calculated by averaging the data from all repetitions, and error bars represent the standard errors of the mean. We used statistical tests to determine the significance of the differences in cytotoxicity levels between the freshly dissolved peptide and the incubated sample at each concentration, as well as between the incubated samples before and after heat shock. A single asterisk (*) was used to denote a p-value between 0.01 and 0.05, indicating a significant difference. Two asterisks (**) were used for p-values between 0.01 and 0.001, indicating a more significant difference. Three asterisks (***) were used for p-values between 0.0001 and 0.001, indicating a highly significant difference. We only displayed differences that were significant and could be attributed to the incubation or heat shock process.

