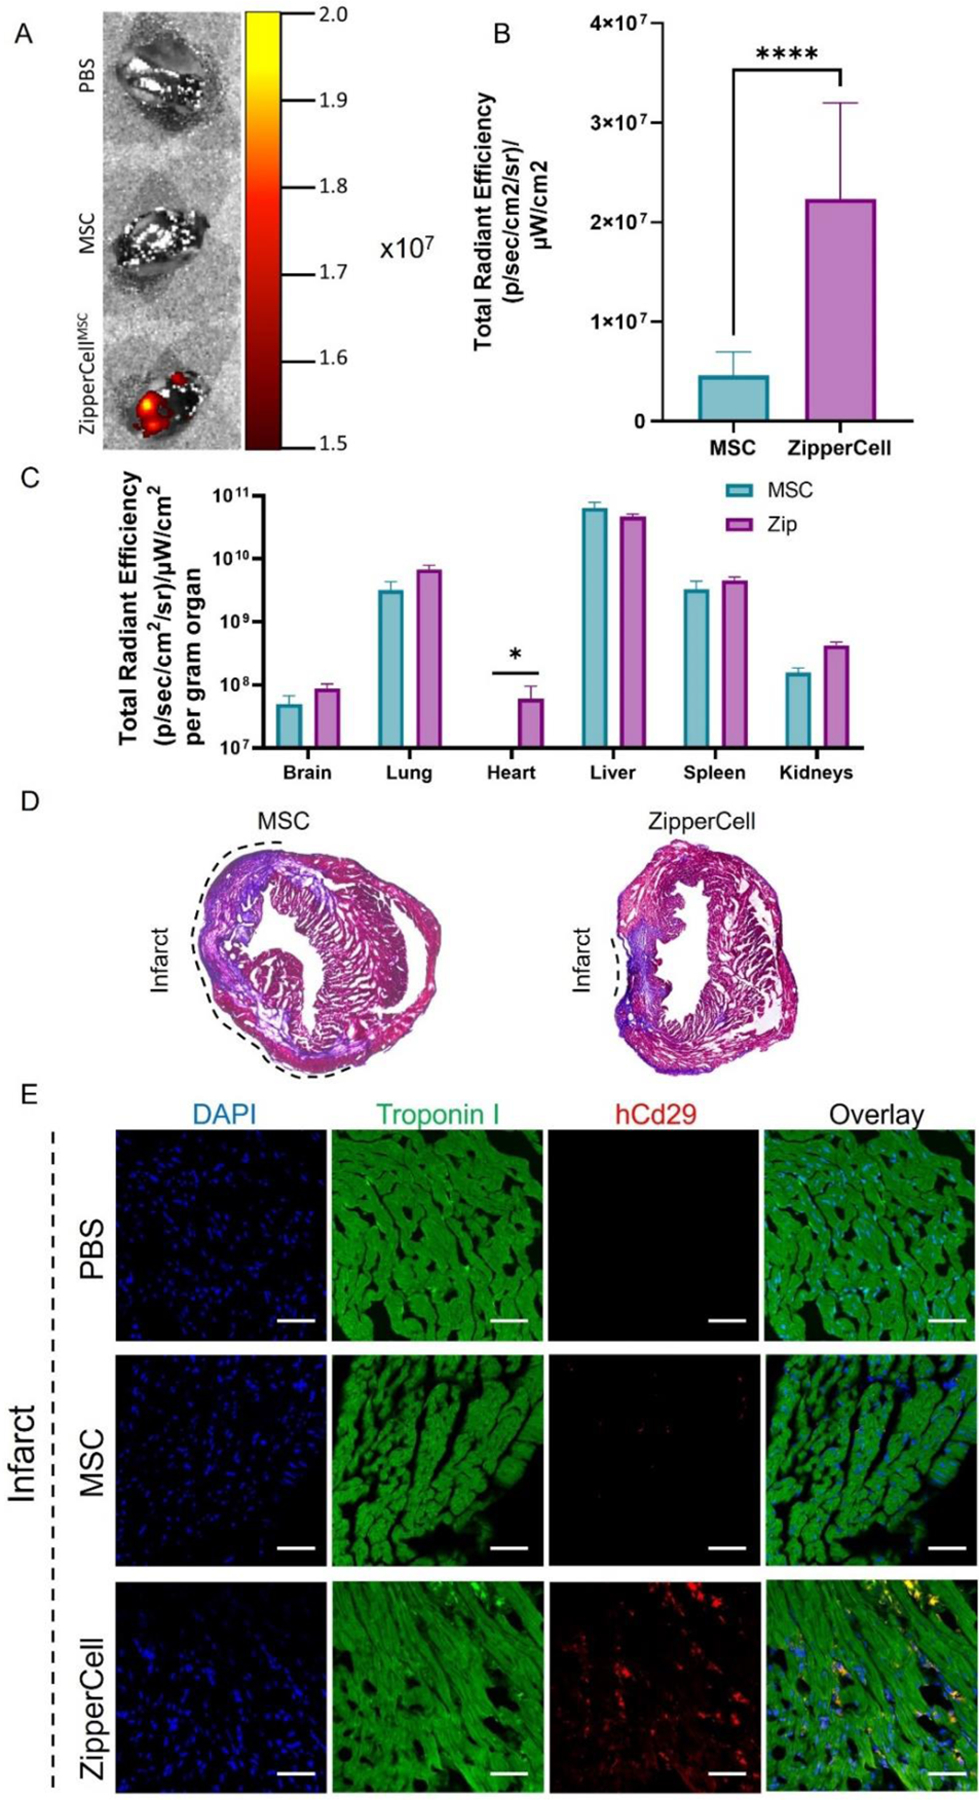
Figure 5.

Biodistribution of MSCs in mice with MI. (A)Representative IVIS images using the IVIS Spectrum in vivo imaging system show DiR-labeled MSC deposition in the infarcted heart. (B) Quantification of DiR fluorescence at the infarcted heart. (C) Quantification of fluorescence in major organs. (D) Masson’s Trichrome staining of whole heart sections. (E) Immunofluorescent staining of cryosections of the infarcted heart of mice treated with PBS, unmodified MSCs, and ZipperCells. Cryosections were stained for Troponin I (green), human CD29 (red), and nuclei (DAPI, blue). Scale bar = 50 µm. Data are presented as mean ± standard deviation. Data are presented as mean ± SD with *p <0.05, **p<0.01, ****p<0.0001 by one-way ANOVA followed by Tukey’s post-test, n=7.
