
Extended Data Fig. 7 |. Comparison of ChiP-seq between eZH2 WT and MT, and validation of G4 RNA-PRC2 binding using TMPyP4.
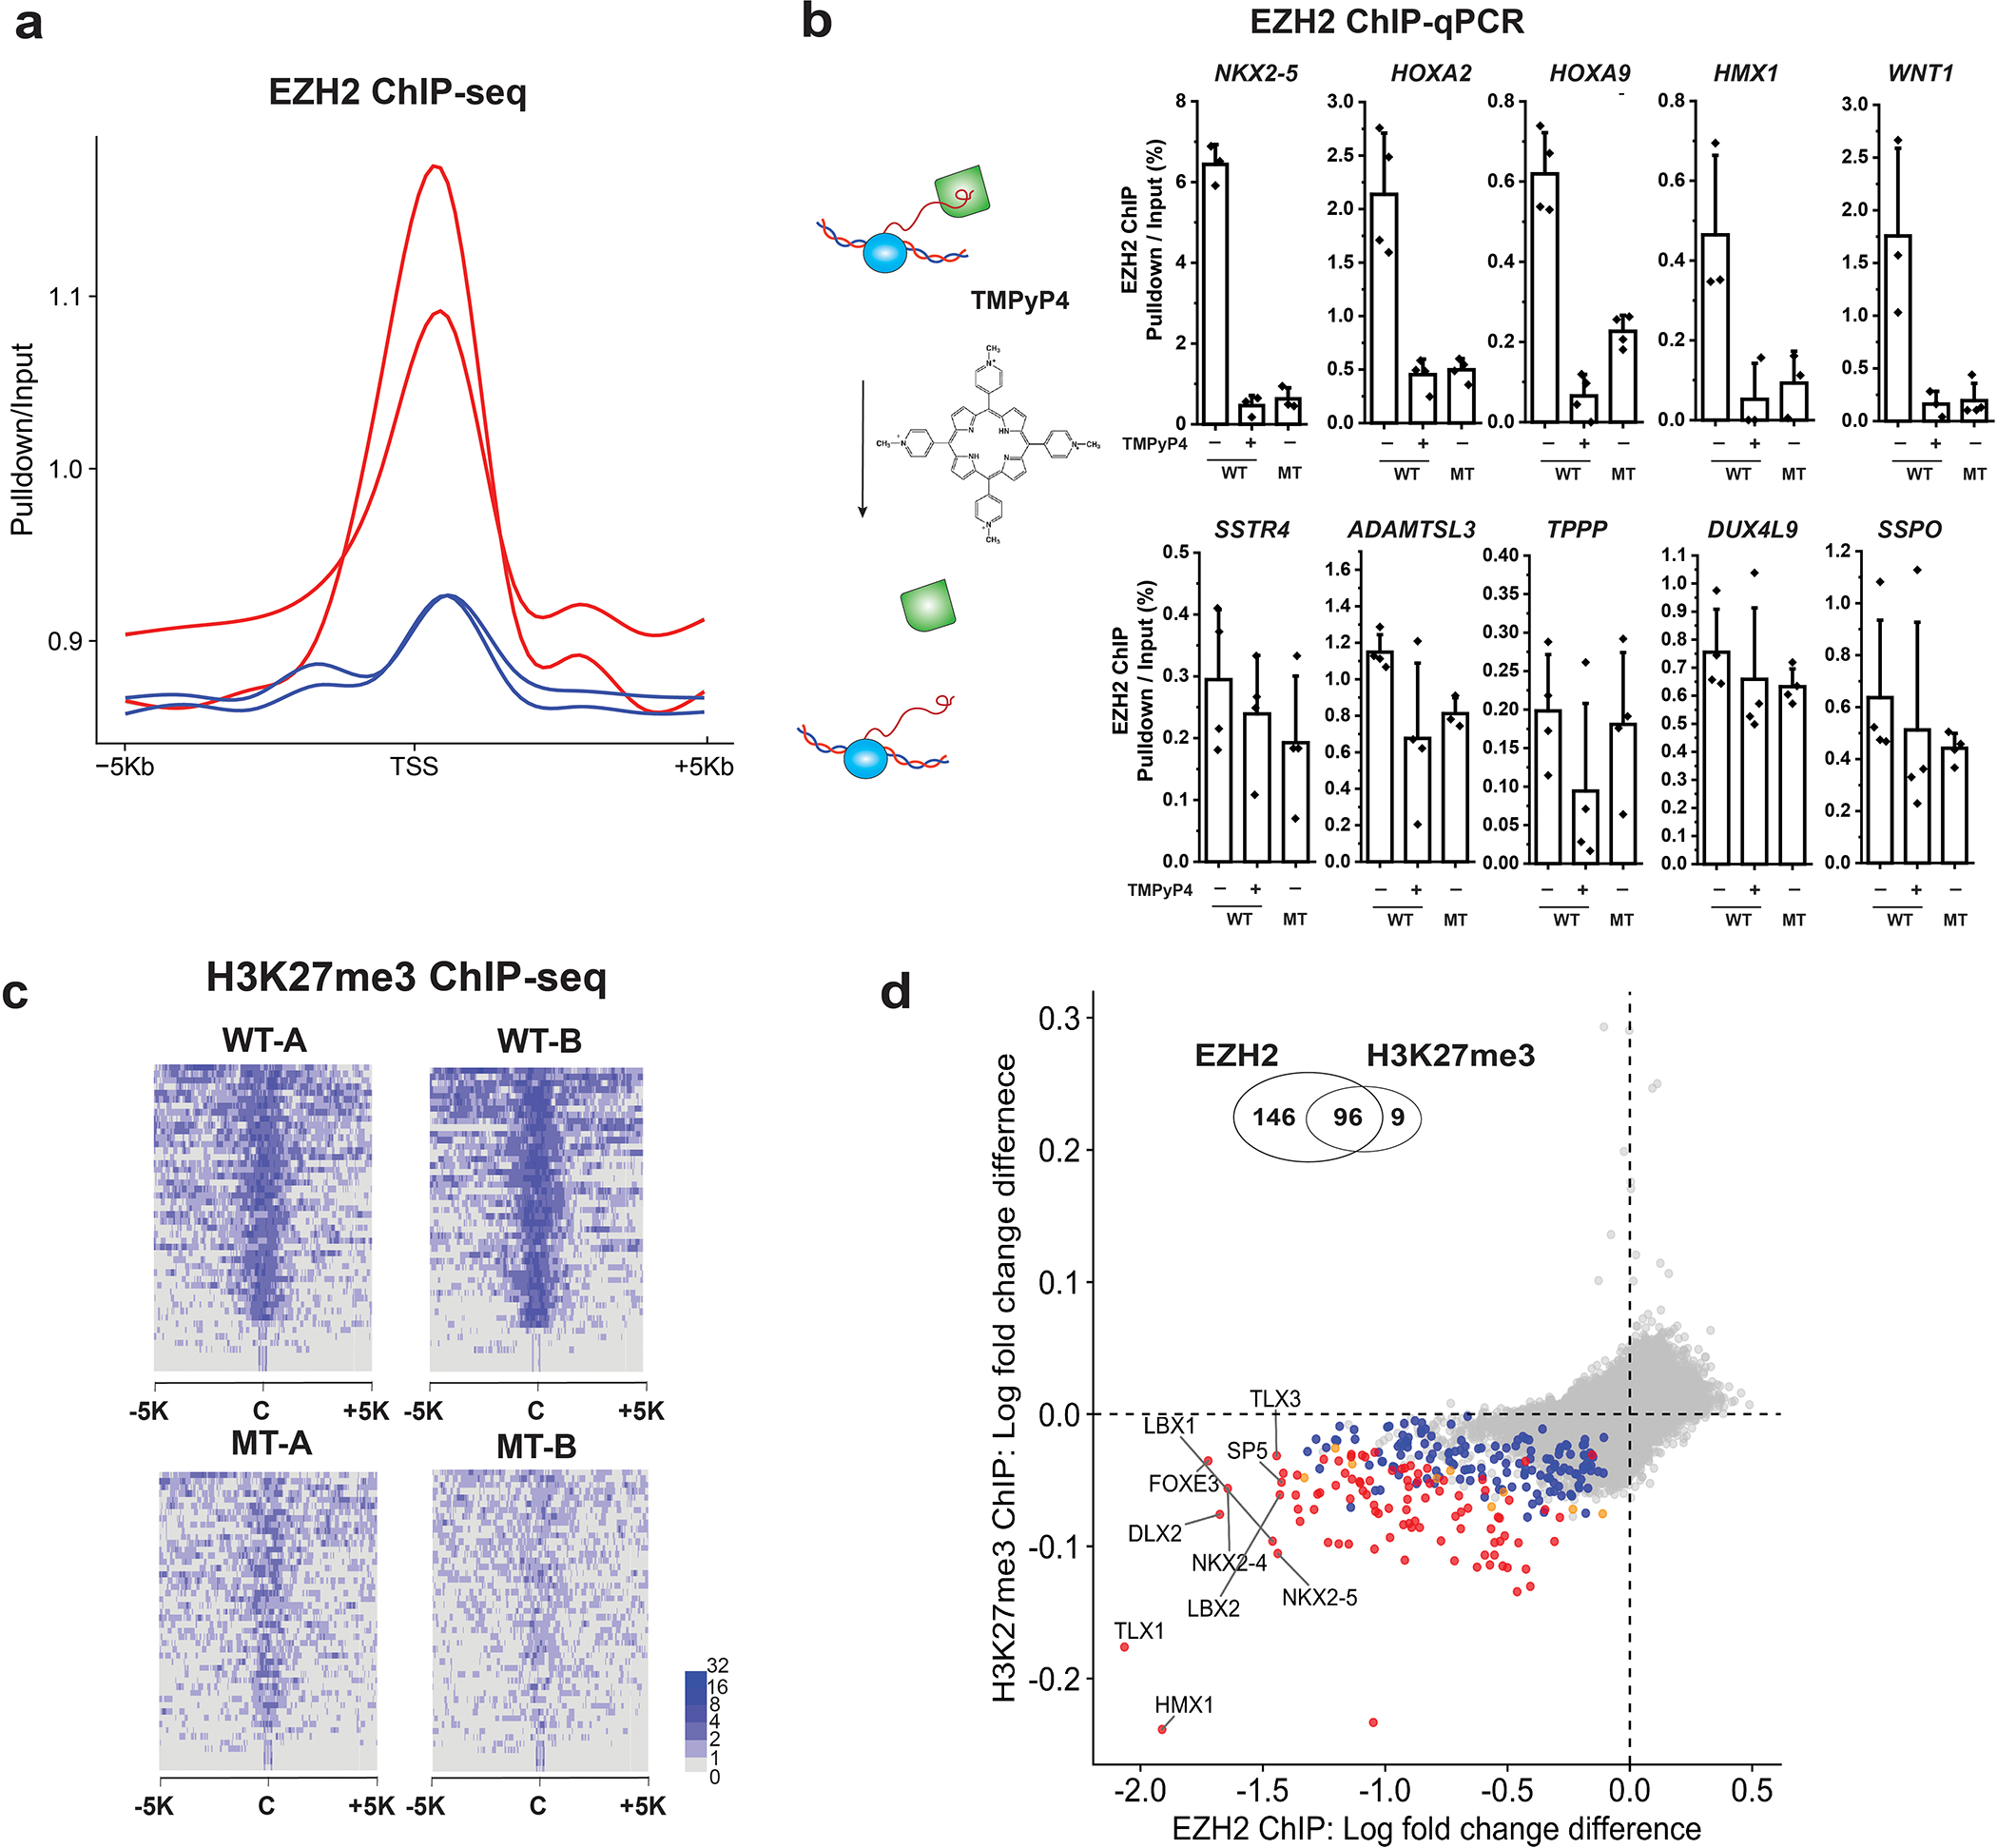
a, Fold changes of EZH2 ChIP-seq in two WT clones (red) and two MT clones (blue) at transcription start site (TSS) + /− 5 kb. b, TMPyP4 treatment phenocopies the RNA-binding defective EZH2 mutant. EZH2 ChIP-qPCR results of WT, WT with TMPyP4 treatment, and MT. Enrichment percentage (pulldown/input) plotted as the Y-axis. Five genes that had significant change of EZH2 occupancy with the mutant EZH2 are shown in the top panels, and the insignificantly changed genes are shown in the lower panels. Each point represents a replicate (N = 3 or 4 biological independent samples). The bar represents mean value and the error bars show standard deviation. c, Fold change of H3K27me3 ChIP-seq. In a heatmap, each row describes a region of 5 kb upstream and downstream from the center of a single peak. d, Comparison of the differential enrichment between WT and MT between EZH2 ChIP (x-axis) and H3K27me3 ChIP (y-axis). The differential enrichment was quantified by subtraction of log2 fold change in WT from log2 fold change in MT. Colors indicate the statistical significance [multiple test corrected (FDR) p-value<0.1 in two-sided empirical Wald test, see Methods] of differential enrichment. The number of these genes are 146 (blue: EHZ2 only), 9 (orange: H3K27me3 only), 96 (red: both) and 36946 (gray: no significance). Venn diagram is shown on the top of scatter plot. Significant overlap of differential genes was found between EZH2 ChIP and H3K27me3 ChIP (Fisher-exact test, p-value < 10−15).