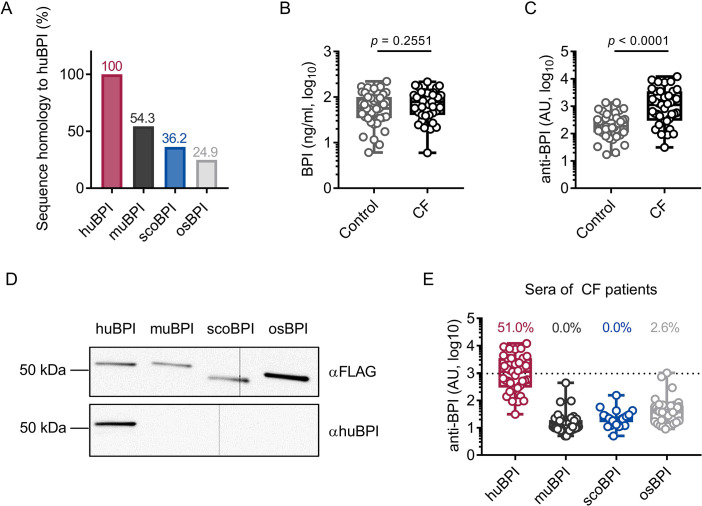
Figure 2. Bactericidal/permeability-increasing protein-anti-neutrophil cytoplasmic antibodies (BPI-ANCA) from people with cystic fibrosis (PwCF) do not recognize orthologous proteins of human BPI (huBPI).
(A) Sequence homology of amino acid sequences to huBPI without signal peptide. (B, C) Levels of BPI (B) and anti-BPI antibodies indicated in arbitrary units (AU; C) in the sera of PwCF and age- and sex-matched healthy controls (n = 39). (D) Western blot analysis of recombinantly expressed proteins. Bands were visualized with anti-FLAG (αFLAG) or anti-human BPI (αhuBPI) antibodies. One representative experiment of two biological replicates using different protein lots in separate assays is shown. (E) Recognition of recombinantly expressed proteins by anti-BPI antibodies present in the sera of the individual PwCF shown in (C, n = 39). The signal cutoff is indicated by a dotted line and was defined as 2 standard deviations above the mean signal determined in the sera of healthy controls shown in (C). Data are shown as box plots showing median, upper, and lower quartiles and whiskers indicating minimal and maximal values (B, C, E) or bar plots using calculated values (A). Sera measurements were performed with samples from 39 individual PwCF and 39 age- and sex-matched controls. For depiction in the logarithmic scale, values of zero were set to the lower limit of detection of the assay (B). Statistical testing was performed using the Mann–Whitney U test. Statistical significance is indicated by p-values.


