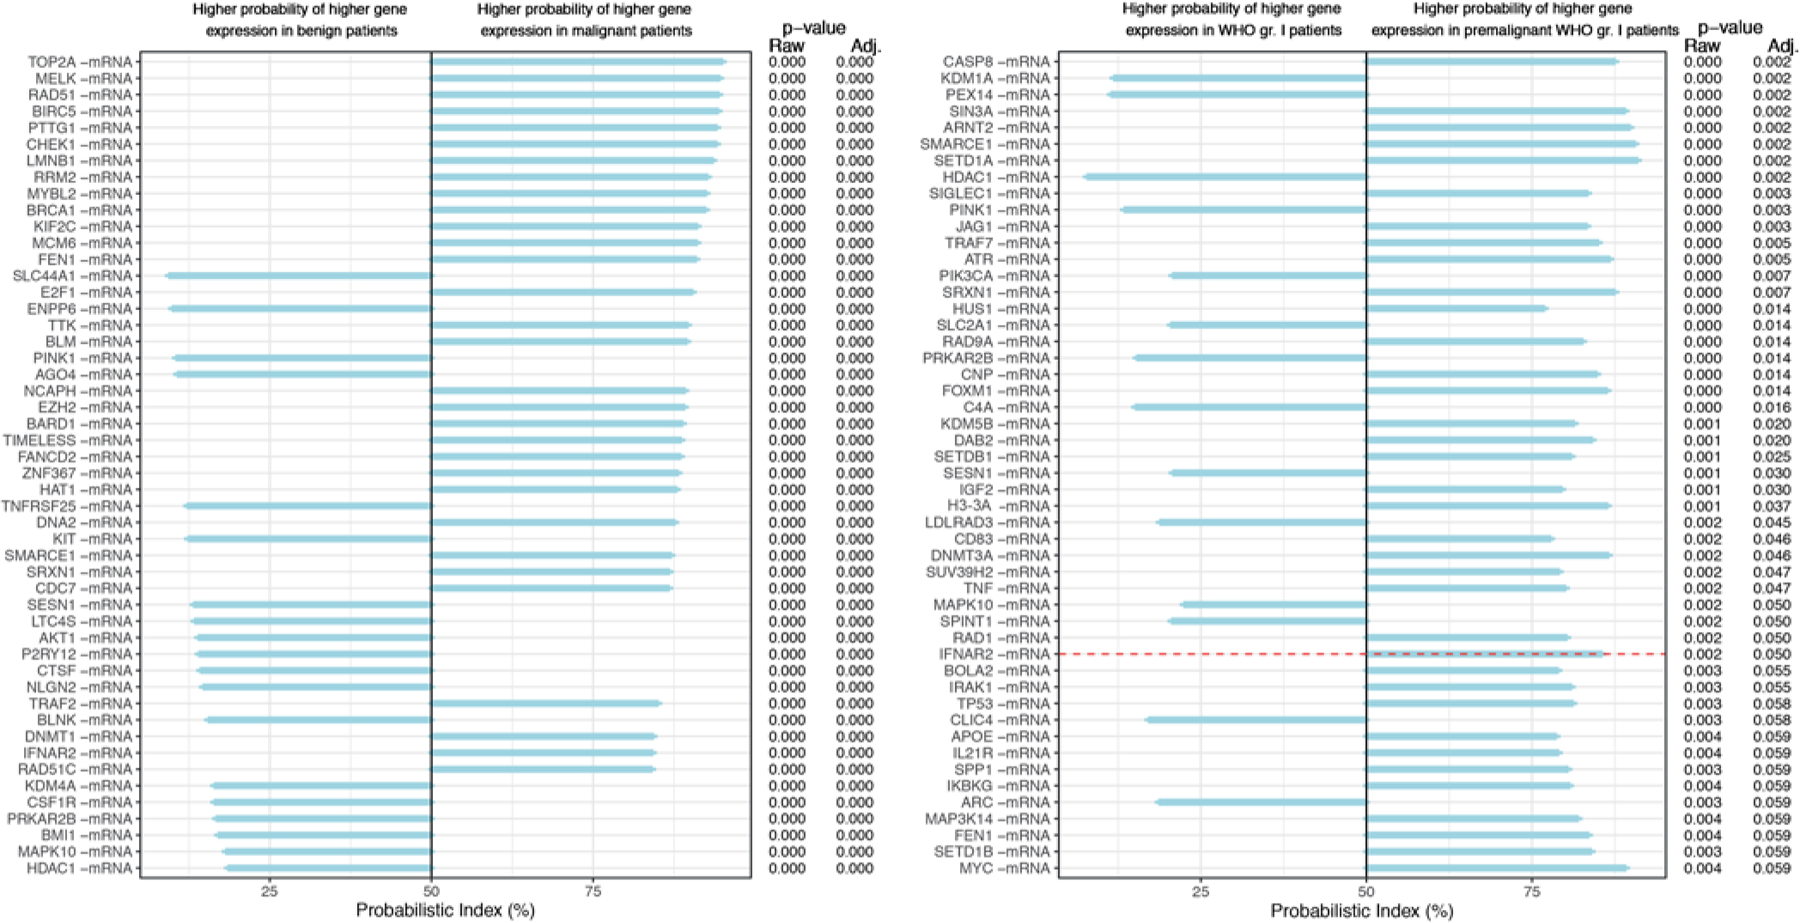
FIG. 2.

PBIs, p values, and adjusted p values for analyses 1 (left) and 2 (right). Left: In analysis 1 the first grade III meningiomas (n = 51) were compared with benign grade I meningiomas from controls (n = 51). The genes are ranked by magnitude of PBI, and the top 50 of the 429 genes (adjusted p < 0.05) are shown. Right: In analysis 2, the first premalignant grade I meningiomas (n = 9) were compared to benign grade I meningiomas (n = 51). Genes are ranked according to adjusted p value, and 37 genes have an adjusted p < 0.05 (border marked with a dotted red horizontal line). Adj. = adjusted; gr. = grade.
