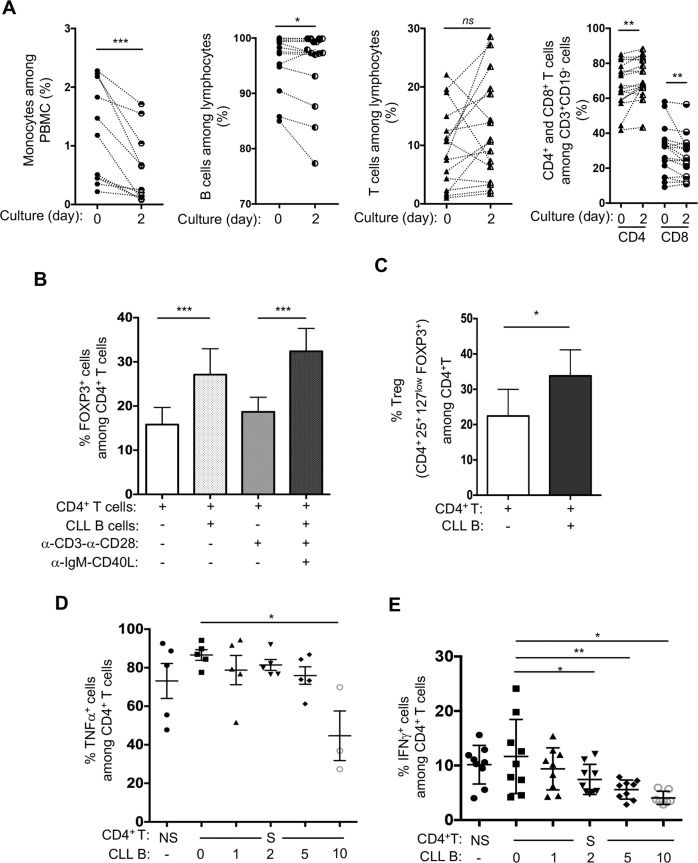
Fig. 1. CLL B cells undertake a regulatory crosstalk with their immune counterparts.
A Frequencies of various cell subsets (monocytes, n = 11; leukemic B cells, n = 17; T cells, n = 16; CD4+/CD8+ T cells, n = 17) were evaluated by flow cytometry from CLL patients PBMCs prior to or upon 2 days of culture. Dotted lines link individual patient samples. Wilcoxon signed-rank test on means *P ≤ 0.05, **P ≤ 0.01, ***P ≤ 0.001, ns not significant. B–E Purified autologous CD4+ T cells stimulated with anti-CD3 and anti-CD28 (+, S) or not (−, NS) were cultured for 2 days in with (+) or without (−) CLL B cells activated (+) or not (−) with CD40L and anti-IgM as indicated and analyzed by flow cytometry. Frequencies of FOXP3+ cells (B), of CD4+CD25+CD127lowFOXP3+ Treg cells (C) out of CD4+ T cells in the culture are graphed (T/B ratio 1:1; n = 5). Autologous CLL CD4+ T and B cells were cultured for 48 h at the indicated ratios (T/B). Scatter dot plots indicate the frequencies of TNFα+ (D; n = 5) and IFNγ+ (E; n = 9) cells out of CD4+ T cells. ANOVA test *P < 0.01; **P < 0.001.

