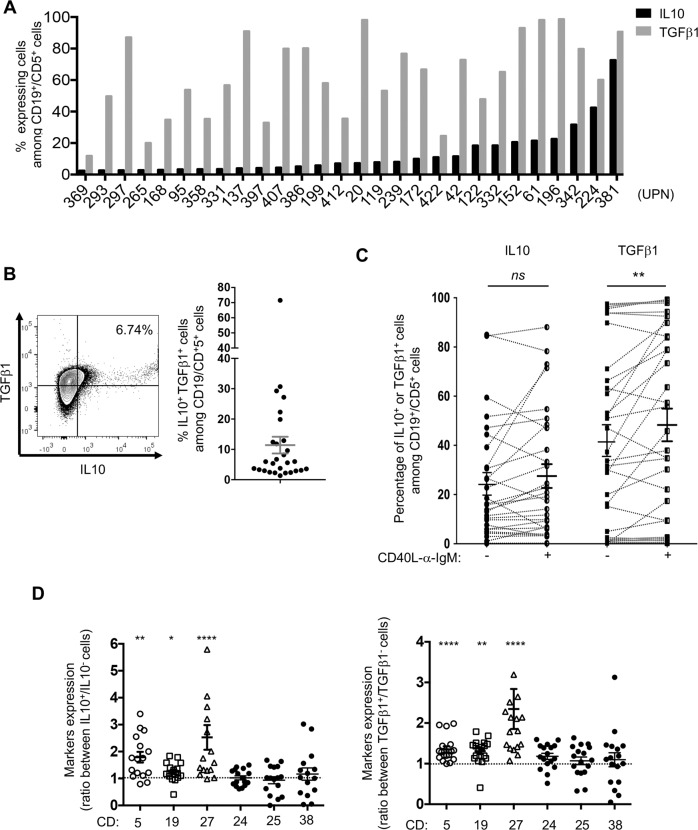
Fig. 2. Specific subsets of CLL B cells express IL10 together with TGFβ1.
A Percentage of IL10-(black bars) or TGFβ1-(grey bars) expressing cells among CD19+ CD5+ cells from patient samples (UPN) were evaluated by flow cytometry and graphed; (n = 28). B Representative dot plot showing IL10+ and TGFβ1+ staining in CD19+/CD5+ cells from a patient PBMC sample (bars indicate the respective control isotypes, UPN 239, left). Graphic representation of the frequency of CLL B cells co-expressing IL10 and TGFβ1 among PBMCs from patients’ samples (right). C Graphic representation of IL10+ or TGFβ1+ purified CLL B cells frequencies. Cells were stimulated or not with CD40L/ anti-IgM for 3 days (IL10 n = 29, TGFβ1 n = 33) and quantified by flow cytometry. Dotted lines link individual patient samples. Paired t-test, **P ≤ 0.01, ns, not significant P > 0.05. D Purified B cells were cultured for 3 days, labelled with the indicated membrane markers and stained for cytoplasmic IL10 or TGFβ1. MFI ratio of CD5, 19, 27, 24, 25, 27 and 38 between IL10 positive versus negative (n = 16, left) or TGFβ1 positive versus negative (n = 17, right) cells are graphed. Wilcoxon signed-rank test *P ≤ 0.05, **P ≤ 0.01, ****P ≤ 0.0001.

