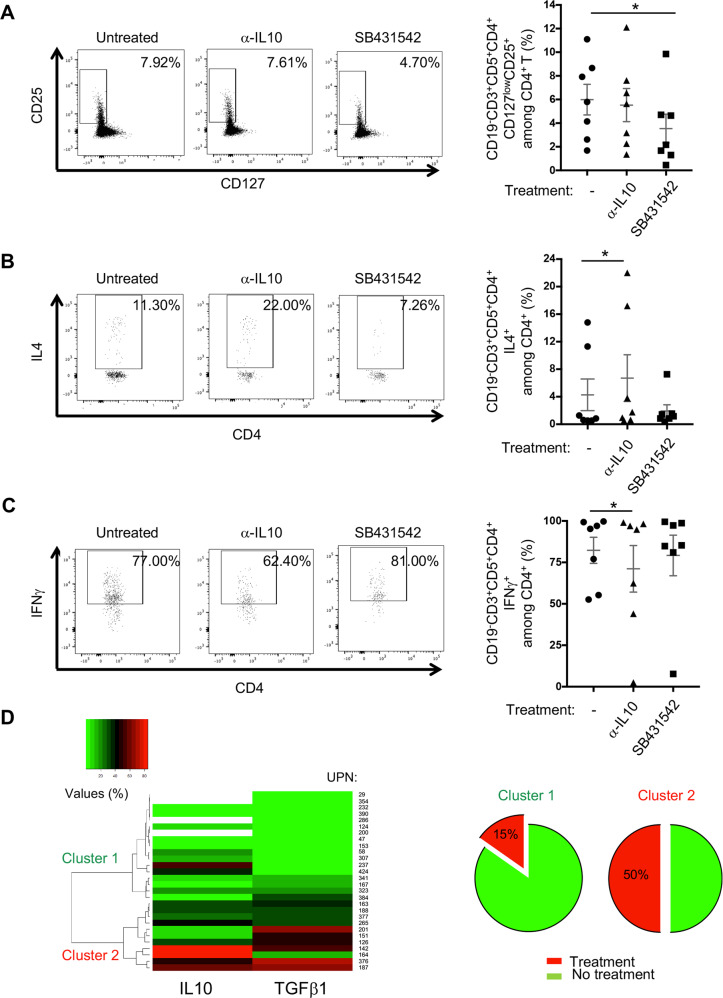
Fig. 4. Functional impact of IL10 and TGFβ1 on their immune counterparts.
Representative flow cytometry dot plots (UPN 008 and 196) and graphic representation of Treg (CD5+ CD4+ CD127low CD25+) (A) Th2 (CD19− CD4+ IL4+) (B) and Th1 (CD19- CD4+ IFNγ+) (C) frequencies in PBMCs (n = 7) left untreated (−) or treated with α-IL10 Ab (10 μg/ml) or TGFβRI inhibitor (SB431542, 5 μM) for 2 days. In the representative dot plots, gates indicate positive events with their respective percentages. D Unsupervised hierarchical cluster analysis of IL10 and TGFβ1 expression in CLL B cells from a cohort of 28 patients (UPN) allowing the distinction of 2 clusters (1 (green color) & 2 (red color)); immunoregulatory factors frequencies (values (%)) in CLL B cells from each patient are depicted in shades of red (higher) and green (lower). Percentage of treated patients (more than two years) prior to the experiment time in Cluster 1 (15%) and Cluster 2 (50%) are presented as pie (cf. Table 1 and Supplementary Table 1 cohort 1).

