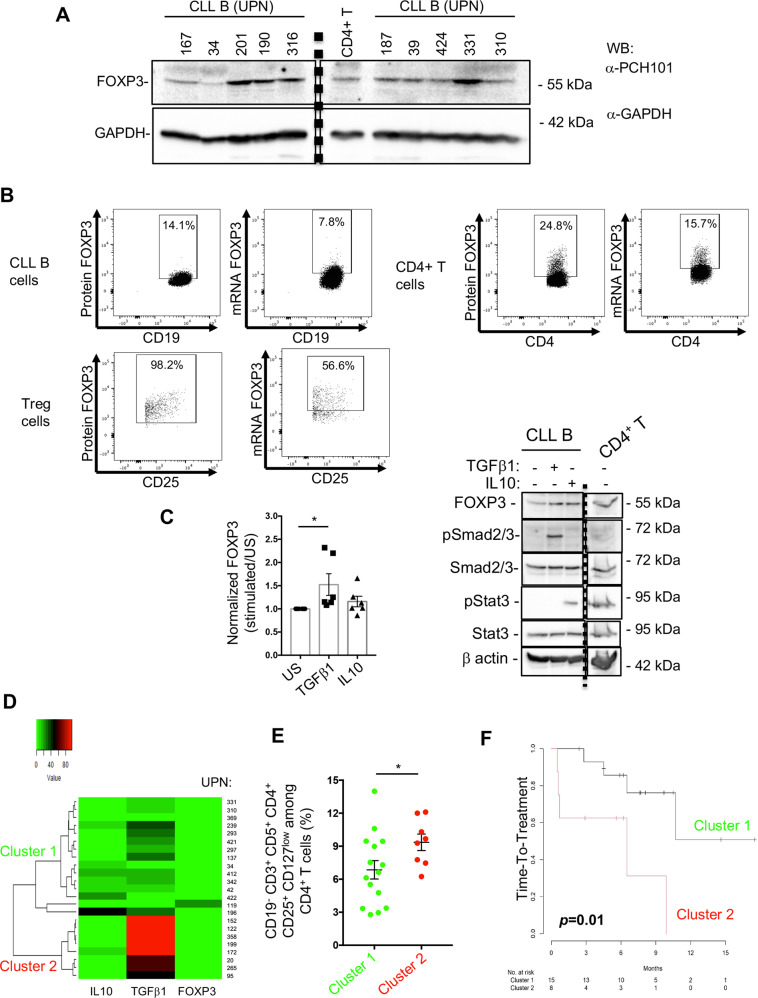
Fig. 5. CLL B cells express FOXP3 with IL10 and TGFβ1, which altogether constitutes a progression indicator.
A Thirty μg of CLL B or CD4+T cell lysates from 10 patients (UPN) were analyzed by western blot with the indicated antibodies; GAPDH was used as a loading control. Vertical dashed line separates a cropped membrane split into two parts with the same exposure time (B). PBMCs from CLL patients were subjected to RNA flow cytometry protocol, in which CLL B, CD4+T and Tregs cells were labeled with dedicated markers and stained for the FOXP3 protein (PCH101) and its RNA (FOXP3 probe). Dot plots depict the targeted cell type and each rectangle shows the positive events with its percentage (UPN 34). C CLL B cells were stimulated or not (US) with TGFβ1 or IL10 for 2 days and cell lysates from 6 patients were analyzed by western blot with the indicated antibodies; β-actin was used as loading control. Fold increase of FOXP3 is graphed; Wilcoxon test and P = 0.0312. D Unsupervised hierarchical cluster analysis of IL10, TGFβ1 and FOXP3 expression in CLL CD19+ CD5+ CD27+ B cells from a cohort of 23 patients (UPN are indicated) determined 2 clusters (1, green and 2, red). Immunoregulatory factors frequencies in CLL B cells are depicted in shades of red (higher) and green (lower). E Frequencies of Tregs among PBMCs are graphed and compared between the two clusters; Mann–Whitney test and P = 0.0473. F According to patients’ clinical annotations (Table 1, Supplementary Table 2 cohort 2), Kaplan–Meier plot shows the time-to-treatment distribution for clusters 1 and 2. Log-rank test was used and P value is indicated.

