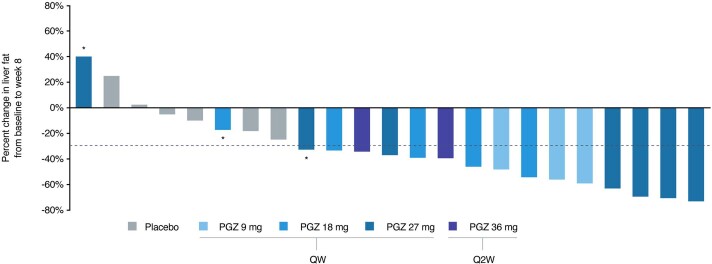
Extended Data Fig. 4. Waterfall plot.
Waterfall plot showing the effect of pegozafermin on liver fat fraction assessed via MRI-PDFF. Data presented for individual participants showing relative change in liver fat from baseline to week 8. Per protocol, the week 8 follow-up MRI-PDFF assessment was to be completed within ±7 days of last dose of study drug, participants noted in asterisks (*) had follow-up MRI-PDFF performed >21 days from date of last dose. The dashed line represents a 30% reduction in liver fat which is commonly used to denote a meaningful change.

