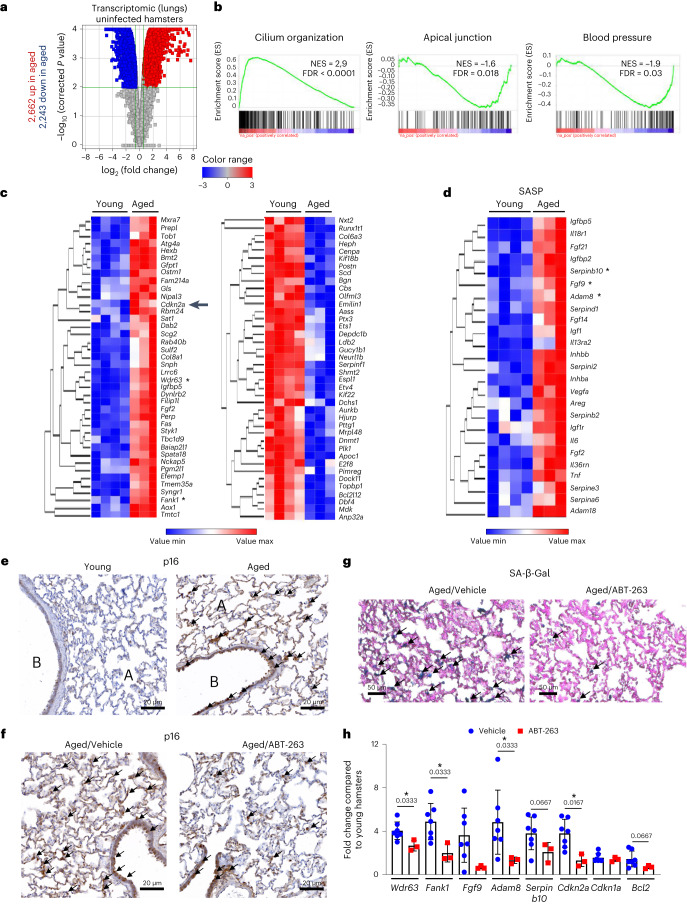
Fig. 1. The transcriptomic analysis of aged lungs and the effect of ABT-263 treatment on senescent cells in the lungs.
a–d, Transcriptomic data were generated from whole lung tissue collected from naive aged hamsters (22 months of age) and naive young hamsters (2 months of age) (n = 3 and n = 4, respectively). Significant differentially expressed genes in aged lungs with fold change cutoffs >1.5 or <1.5 and moderated t-test P < 0.01 after Benjamani–Hochberg correction were considered. a, Volcano plot of transcriptomic data is depicted. The x axis represents the log2-transformed fold change for differentially expressed genes in aged versus young lungs, and the y axis represents the log10. b, GSEA plots showing the enrichment of upregulated genes (red) and repressed genes (blue) in aged hamsters relative to young hamsters at baseline. The y axis indicates the normalized enrichment score (NES). c,d, Heat maps showing significantly modulated genes related to ‘cellular senescence’ (c) and SASP-related factors (d) with the highest fold change in expression. The log2 expression range values are indicated by the color scale. Asterisks denote genes shown in h. e, Lungs from aged hamsters and young hamsters were stained with anti-p16. Arrows indicate p16-positive cells. A, lung alveoli; B, bronchi. f, The same procedure was repeated but this time in aged hamsters receiving (or not) ABT-263. Scale bars, 20 μm. g, SA-β-Gal staining of lung sections after ABT-263 treatment in aged hamsters. h, Relative expression levels of transcripts identified in b and c (marked with an asterisk) and transcripts moderately upregulated in aged lungs but relevant in senescence (Cdkn1a and Bcl2) as assessed by RT–PCR assays (lung) (n = 3–7). The data are expressed as the mean ± s.d. fold change relative to average gene expression in young animals. a–d, One experiment performed. e,h, One representative experiment out of two is shown. h, Significant differences were determined using the two-tailed Mann–Whitney U-test. *P < 0.05.

