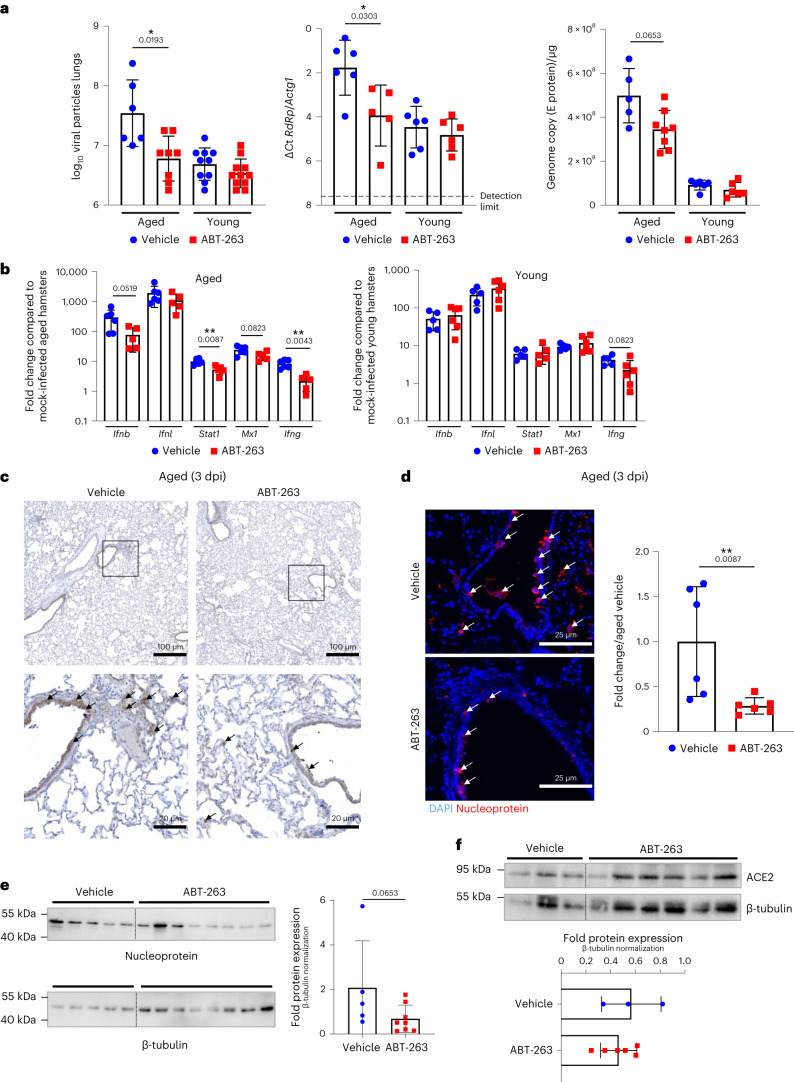
Fig. 4. Effect of ABT-263 treatment on viral loads and ACE2 expression in lungs.
Aged hamsters and young hamsters were treated (or not) with ABT-263 and then infected with SARS-CoV-2. Animals were euthanized at 3 dpi. a, Determination of viral loads in the lungs. Left: the number of infectious particles was determined in a TCID50 assay. The data are expressed as the number of infectious virus particles per lung (n = 6–11). Middle and right: quantification of viral RdRp and E protein transcript levels in the whole lungs, using RT–PCR. The data are expressed as ΔCt and genome copy per microgram of RNA (n = 5–8). b, mRNA copy numbers (for IFNs and ISGs) were quantified by RT–PCR. The data are expressed as the fold change relative to average gene expression in mock-infected animals (n = 5–6). c, Immunohistochemistry analysis of spike in the lung from SARS-CoV-2-infected, aged hamsters treated (or not) with ABT-263. Scale bars, 100 μm and 20 μm. d, Viral nucleoprotein labeling (immunofluorescence) was performed on lung sections. Scale bars, 25 μm. Right: the histograms indicate the fold change relative to average intensity in vehicle-treated infected, aged animals (n = 6). e,f, Expression of the viral nucleoprotein, ACE2 and β-tubulin (western blotting) in vehicle-treated and ABT-263-treated SARS-CoV-2-infected, aged hamsters (whole lung homogenates). The relative protein levels normalized to β-tubulin are shown (n = 3–8). For all graphs, errors indicate mean ± s.d. Pooled results from two independent experiments (a) and one of two representative experiments (b–e) are shown. Significant differences were determined using the two-tailed Mann–Whitney U-test (b,d,e,f) or one-way ANOVA Kruskal–Wallis test (non-parametric), followed by Dunn’s post test (a). *P < 0.05, **P < 0.01.

