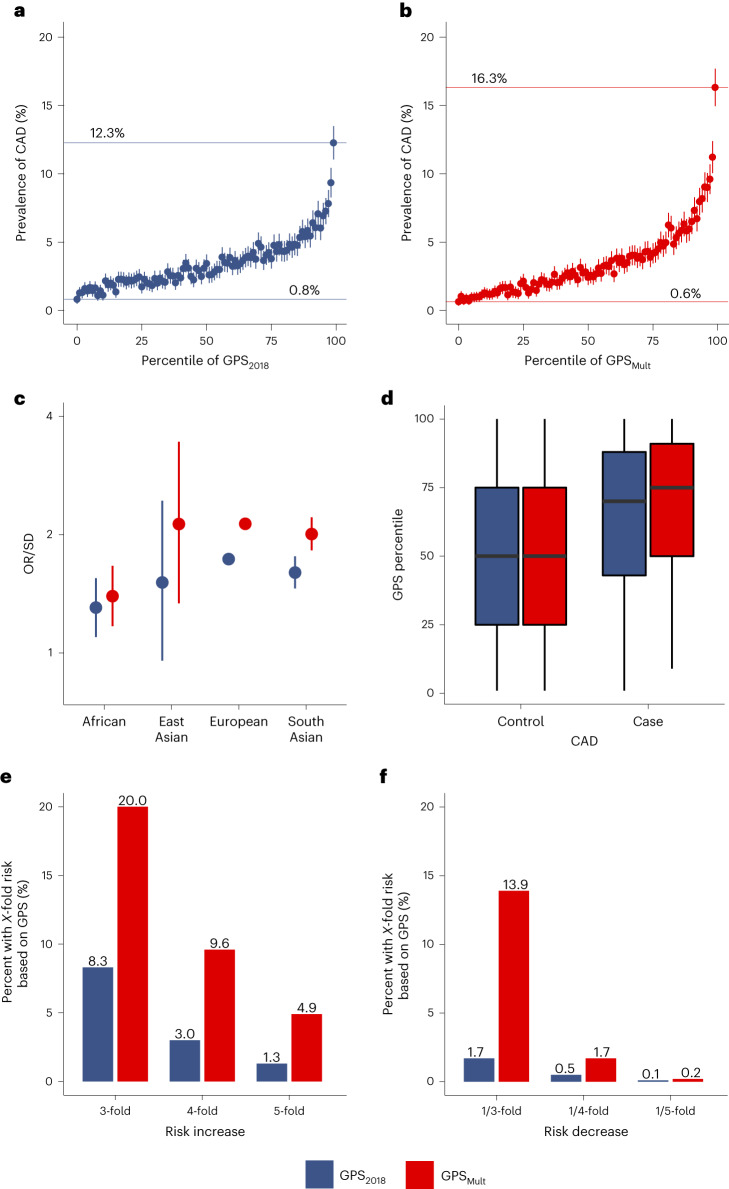
Fig. 3. Improvements in polygenic prediction of prevalent CAD prediction.
a,b, The mean prevalence of CAD with 95% CI according to 100 groups of the UK Biobank European ancestry validation dataset consisting of n = 308,264 independent participants, binned according to the percentile of the GPS2018 (a) and GPSMult (b). c, The OR/SD with 95% CI for prevalent CAD of GPSMult was assessed in a logistic regression model adjusted for age, sex and the first ten principal components of ancestry in n = 7,281 independent individuals of African ancestry, n = 1,464 independent individuals of East Asian ancestry, n = 308,264 independent individuals of European ancestry, and n = 8,982 independent individuals of South Asian ancestry. d, Distributions of GPS2018 and GPSMult percentiles across the UK Biobank European ancestry validation dataset consisting of n = 308,264 independent participants. For all box plots: central line of each box, median; top and bottom edges of each box, first and third quartiles; whiskers extend 1.5× the interquartile range beyond box edges. e, Proportion of UK Biobank validation population with 3-, 4- and 5-fold increased risk for CAD versus the middle quintile of the population, stratified by GPS. The odds ratio assessed in a logistic regression model adjusted for age, sex, genotyping array and the first ten principal components of ancestry. f, Proportion of UK Biobank testing population with 1/3, 1/4, and 1/5 risk for CAD versus the middle quintile of the population, stratified by GPS. Odds ratio assessed in a logistic regression model adjusted for age, sex, genotyping array and the first ten principal components of ancestry.

