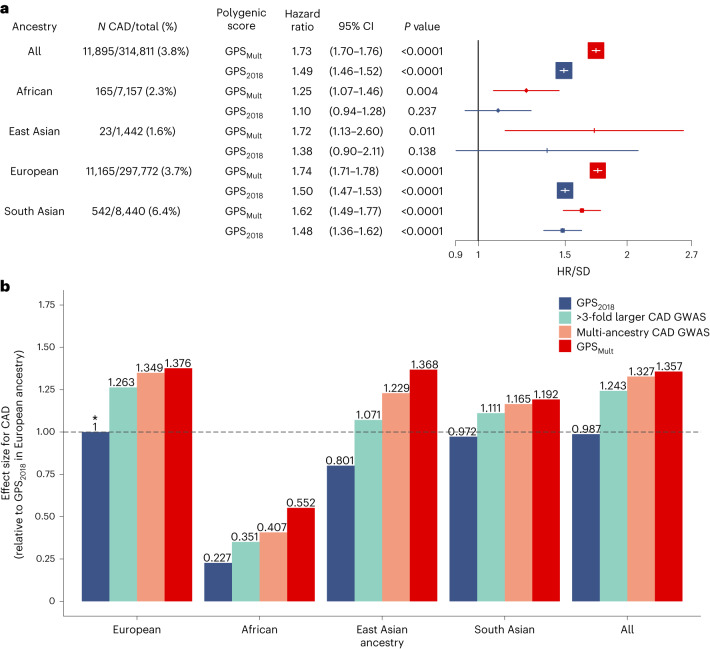
Fig. 5. Incident CAD prediction by GPSMult stratified by ancestry.
a, Adjusted HR/SD of the polygenic score with corresponding 95% CIs and P values for incident CAD by ancestry, stratified by the version of the polygenic score, calculated from Cox proportional-hazards regression models adjusted for age, sex, genotyping array and the first ten principal components of ancestry in the UK Biobank validation dataset, consisting of n = 7,157 independent individuals of African ancestry, n = 1,442 independent individuals of East Asian ancestry, n = 297,772 independent individuals of European ancestry, and n = 8,440 independent individuals of South Asian ancestry. GPS2018 corresponds to a previously published polygenic score for CAD9. P values are derived from a Wald test implemented in the coxph function in R and are two-sided. b, The score effect sizes relative to the effect size of GPS2018 in European ancestry individuals. ‘>3-fold larger CAD GWAS’ designates a polygenic score generated using summary statistics of largely European ancestry from the most recent CARDIOGRAMplusC4D excluding the UK Biobank (GPSCADEUR). ‘Multi-ancestry CAD GWAS’ refers to the polygenic score generated by combining ancestry-specific polygenic scores generated using GWAS summary statistics from CARDIOGRAMplusC4D, Genes & Health, Biobank Japan, Million Veteran Program and FinnGEN biobanks in layer 1 (GPSCADANC). GPSMult designates polygenic score for CAD designed with summary statistics from multiple ancestries and multiple CAD-related traits in layer 2. Asterisk designates the reference group for calculating relative gain.

