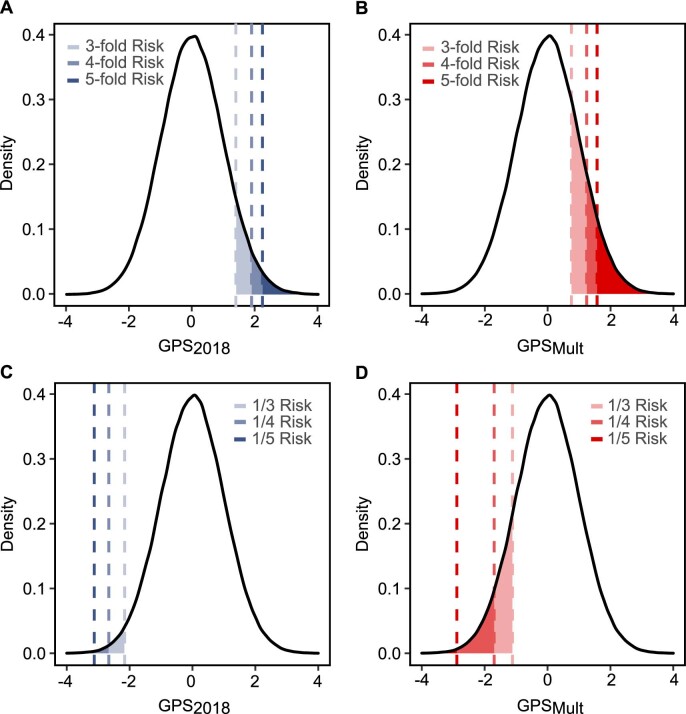
Extended Data Fig. 3. Coronary artery disease risk in the extreme ends of the polygenic score distribution.
Proportion of UK Biobank validation population with 3, 4, and 5-fold increased risk for CAD versus the middle quintile of the population identified by GPS2018 (A) and GPSMult (B). The odds ratio assessed in a logistic regression model adjusted for age, sex, genotyping array, and the first ten principal components of ancestry. Proportion of UK Biobank testing population with 1/3, 1/4, and 1/5 risk for CAD versus the middle quintile of the population, population identified by GPS2018 (C) and GPSMult (D). Odds ratio assessed in a logistic regression model adjusted for age, sex, genotyping array, and the first ten principal components of ancestry. GPS: Genome-wide polygenic score; CAD: coronary artery disease.

