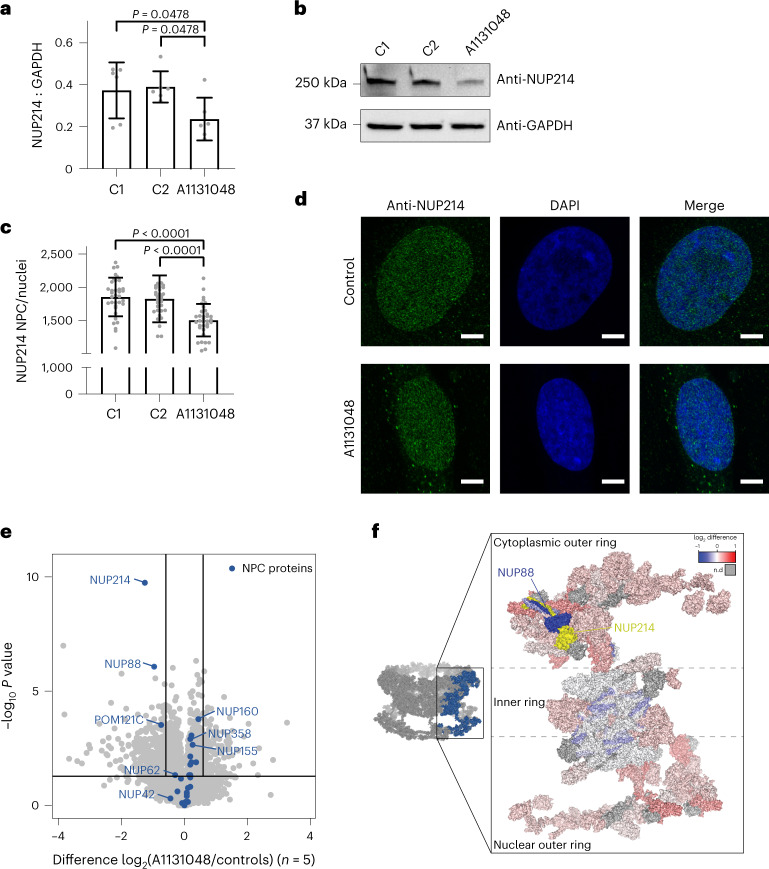
Fig. 5. Decreased NUP214 steady-state levels and decreased NUP214-containing nuclear pore complex density in fibroblasts from A1131048.
a, Densitometry shows significantly reduced NUP214 levels in fibroblasts compared to controls. n = 6 biological samples per cell line. Data represent mean ± s.d. One-way analysis of variance (ANOVA) with Holm–Sidak’s multiple comparisons test. b, Representative western blot of NUP214 in fibroblasts from A1131048 and two controls (C1 and C2). c, Quantification of NUP214-containing nuclear pore complex pore density (pores per nucleus) in fibroblasts from A1131048 compared to controls shows a significant decrease in fibroblasts from A1131048. n = 3 biological samples per cell line, from three independent experiments, represented is pooled data from from n = 35 for C1, n = 31 for C2 and n = 35 for A1131048. Data represent mean ± s.d. One-way ANOVA with Holm–Sidak’s multiple comparisons test. d, Compressed Z-stack representative images of NUP214 immunostaining (green spots) and nucleus (4,6-diamidino-2-phenylindole (DAPI); blue) in fibroblasts from A1131048 and controls. Scale bars, 5 μm. Images are representative from three experiments. e, Volcano plot showing protein abundances in the fibroblasts from A1131048 relative to healthy controls (n = 5). Nuclear pore complex (NPC) components are indicated in blue. The horizonal line represents P = 0.05 and the vertical lines represent fold changes of ±1.5. Data were derived from a two-sided Student’s t-test. No adjustments were made for multiple comparisons. f, Topographical heat map showing fold changes of NPC proteins identified by proteomics mapped onto the structure of the NPC cytosolic face (Protein Data Bank, 7TBL). Yellow indicates NUP214 subunit. Other subunits, including NUP88, which is coiled around NUP214, are colored according to their fold change relative to controls, as indicated in the inset; gray indicates no data.

