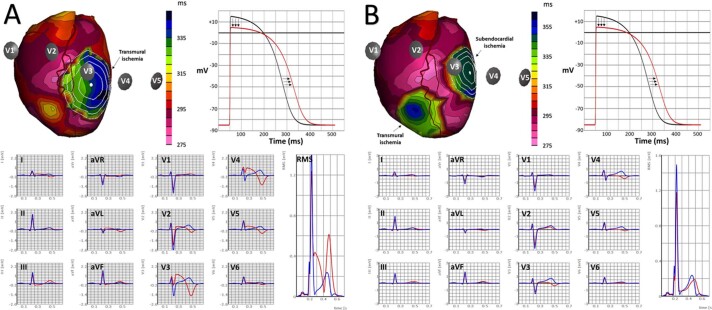
Extended Data Fig. 7. Limitations of ST amplitude on surface ECG as a sole marker of myocardial ischemia.
This figure shows: (a) cardiac model of anterior wall epicardial ischemia with corresponding ST-elevation on V3 to V5 of the 12-lead ECG. (b) cardiac model of anterolateral and inferior-apical epicardial ischemia with corresponding attenuation of ST changes on the 12-lead ECG. This figure was generated using ECGSIM (www.ecgsim.org). Reproduced with permission from Al-Zaiti et. al.1 (permission number 5471421247333, Licensed content publisher: Elsevier).

