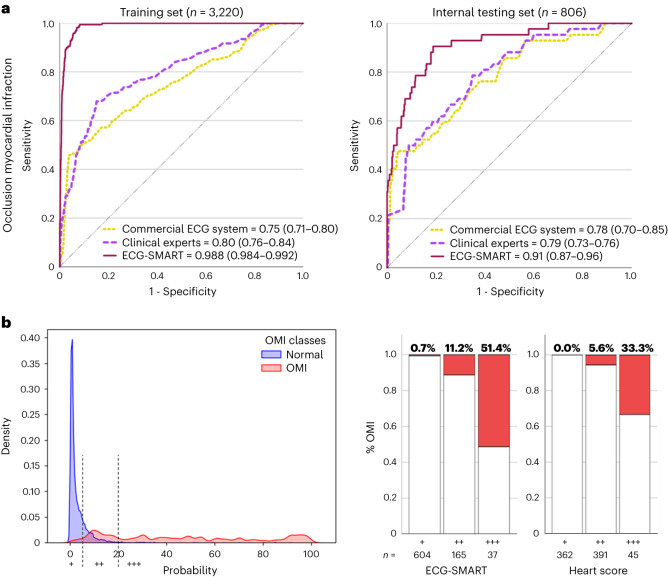
Fig. 2. Algorithm derivation and testing.
This figure shows the classification performance of the machine learning model against other reference standards for detecting OMI (a), the probability density plots of OMI(+) and OMI(−) classes as denoted by the machine learning model, along with optimal cutoffs of low risk, intermediate risk and high risk (b, left), and distribution of patients in low risk (+), intermediate risk (++) and high risk (+++) as per the machine learning model and HEART score (b, right).

