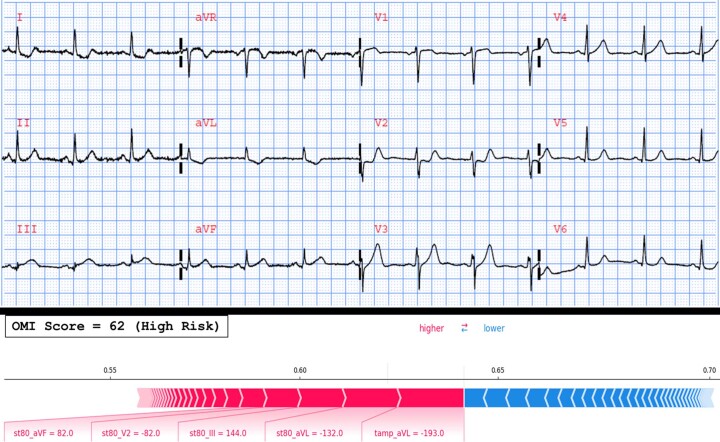
Extended Data Fig. 3. Local explainability of feature importance on a selected example.
This figure shows the baseline ECG of a 50-year-old female with a past medical history of hypertension, high cholesterol, prior myocardial infarction, and current smoking. The ECG was documented as benign with isolated non-specific T wave changes, and the patient was triaged as intermediate risk. The patient was later sent to the catheterization lab where she had complete occlusion of the right coronary artery. The OMI score on this baseline ECG was 62 indicating high risk designation. The force plot identified the five most important ECG features that met the contribution threshold of the random forest model: negative T wave in aVL, slight ST depression in aVL and V2, and slight ST elevation in aVF and III.

