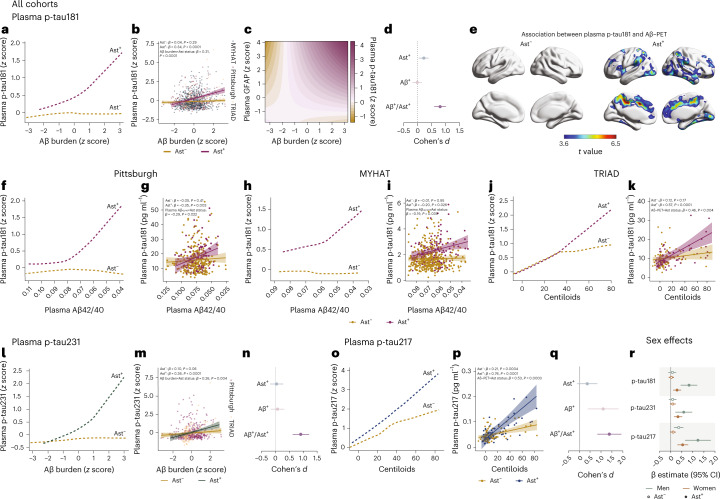
Fig. 1. Astrocyte reactivity influences Aβ-dependent tau phosphorylation.
a, Robust linear regressions show that plasma p-tau181 increases as a function of Aβ burden only in the presence of astrocyte reactivity (Ast+) in all cohorts together (n = 1,016). b, Linear regressions adjusted for age and sex revealed an interaction between Aβ burden and astrocyte reactivity status on p-tau181 levels in all cohorts (n = 1,016). Shaded areas represent 95% confidence intervals of the regression lines. c, Continuous association between Aβ pathology, plasma p-tau181 and plasma GFAP adjusted for age and sex (n = 1,016). d, Cohen’s d analysis accounting for age and sex shows the effect sizes of Aβ and astrocyte reactivity status on plasma p-tau181 (n = 1,016). The error bars represent the 95% confidence interval. e, Voxel-wise regressions, corrected for multiple comparisons, show that Aβ–PET is associated with plasma p-tau181 only in CU Ast+ in typical AD regions (TRIAD cohort, n = 147). f–k, Robust locally weighted and linear regressions adjusted for age and sex show that plasma p-tau181 increases as a function of Aβ burden only in Ast+ individuals and with a significant interaction between Aβ and astrocyte reactivity status on p-tau181 levels in (f,g) Pittsburgh (n = 355), (h,i) MYHAT (n = 514) and (j,k) TRIAD (n = 147) cohorts. Shaded areas represent 95% confidence intervals of the regression lines. l,m, Robust locally weighted and linear regressions adjusted for age and sex show that (l) plasma p-tau231 increases as a function of Aβ burden only in Ast+ individuals and with (m) a significant interaction between Aβ burden and astrocyte reactivity status on p-tau231 (n = 502). n, Cohen’s d analysis accounting for age and sex shows the effect sizes of Aβ and astrocyte reactivity status on plasma p-tau231 (n = 502). The error bars represent the 95% confidence intervals. o,p, Robust locally weighted and linear regressions adjusted for age and sex show that (o) plasma p-tau217 increases as a function of Aβ burden only in Ast+ individuals and with (p) a significant interaction between Aβ burden and astrocyte reactivity status on p-tau217 (n = 136). Shaded areas represent 95% confidence intervals of the regression lines. For illustrative purposes only, two individuals with high plasma p-tau181 and p-tau217 concentrations were not shown in k and p, but they were fully included in the statistical analyses. q, Cohen’s d analysis accounting for age and sex shows the effect sizes of Aβ and astrocyte reactivity status on plasma p-tau217 (n = 136). The error bars represent the 95% confidence intervals. r, β estimates with respective 95% confidence interval of linear regressions showing the effect of sex on the associations of Aβ with plasma p-tau epitopes in Ast− and Ast+ (n = 1,016). Green dots represent men and orange dots women. Solid dots represent Ast+ individuals.

