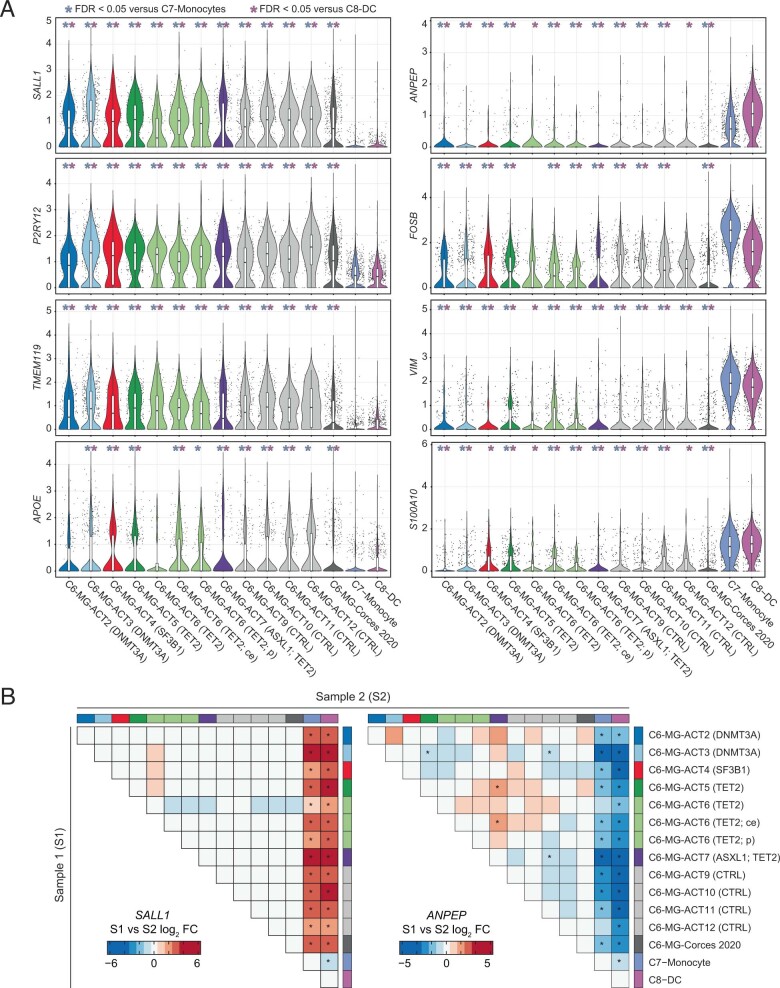
Extended Data Fig. 7. Quantification of gene accessibility in microglia subsets.
a) For each gene, accessibility in each single nucleus is plotted (quantified via ArchR GeneScore). The n for each brain sample is the number of nuclei in the microglia cluster (C6) analyzed in a single experiment for each sample, which is listed in Supplementary Table 15. n = 7,982 nuclei for C7-monocyte and n = 2,369 nuclei for C8-DC. b) Fold change and statistical significance when comparing all pairs of groups for SALL1 (left) and ANPEP (right). (A-B) Within the microglia cluster (C6), cells are split by donor and brain region. Aggregated Corces 2020 microglia, as well as C7-Monocyte and C8-DC clusters, are included for reference. Statistical significance and fold change was computed for all pairs of groups for all GeneScores using the Wilcoxon test. * denotes FDR < 0.05.

