
Fig. 3. Associations of CHIP to AD by APOE genotype and mutated driver gene.
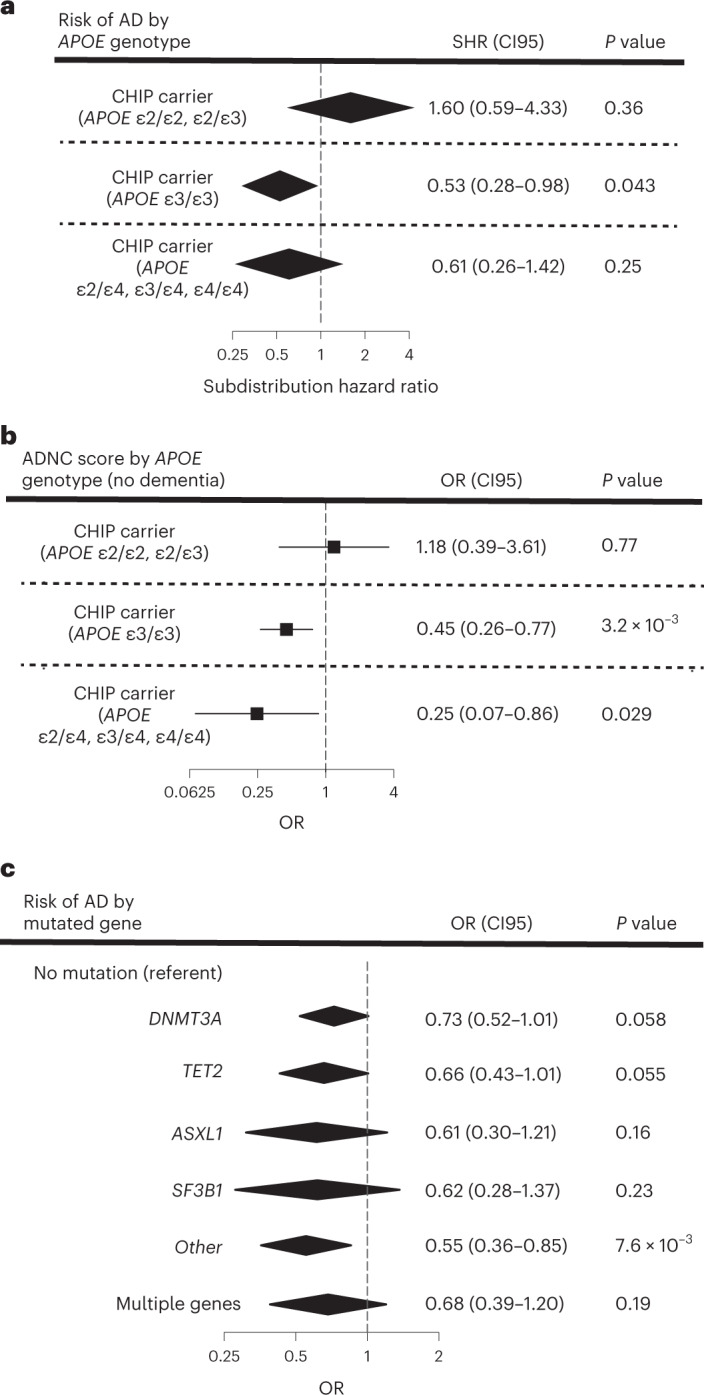
a, Effect of CHIP on AD dementia risk in participants from CHS and FHS stratified by APOE genotype. Participants were binned into those with neutral (APOE ε3ε3), low-risk (APOE ε2ε2 and ε2ε3) and high-risk (any APOE ε4 allele) groups. SHR, 95% confidence intervals (CI95) and two-sided Wald P values were calculated for each covariate (age at the time of blood draw for sequencing, sex and CHIP carrier status) from CRR models, and results from FHS and CHS were then meta-analyzed using a fixed-effects model (Supplementary Table 10 for full regression results). Adjustments for multiple comparisons were not performed. People, n = 3,180. b, Effect of CHIP on ADNC score in cognitively intact participants from ADSP stratified by APOE genotype. Participants were binned into those with neutral (APOE ε3ε3), low-risk (APOE ε2ε2 and ε2ε3) and high-risk (any APOE ε4 allele) groups. ORs, CI95 and two-sided Wald P values were calculated for a six-point composite score of CERAD and Braak stages and analyzed using an ordinal logistic regression model with age at death, sex and CHIP carrier status as covariates (Supplementary Table 10 for full regression results). Adjustments for multiple comparisons were not performed. People, n = 422. c, Effect of mutated CHIP gene on AD in participants from CHS, FHS and ADSP. OR, CI95 and two-sided Wald P values were calculated for each covariate (age at the time of blood draw for sequencing, sex, cohort and APOE genotype) from logistic regression models, and results from the TOPMed cohorts and ADSP were then meta-analyzed using a fixed-effects model (Supplementary Table 12 for full regression results). Adjustments for multiple comparisons were not performed. People, n = 5,730. For all forest plots, the measure of center is the SHR or OR and the lines represent the CI95 for the SHR or OR.