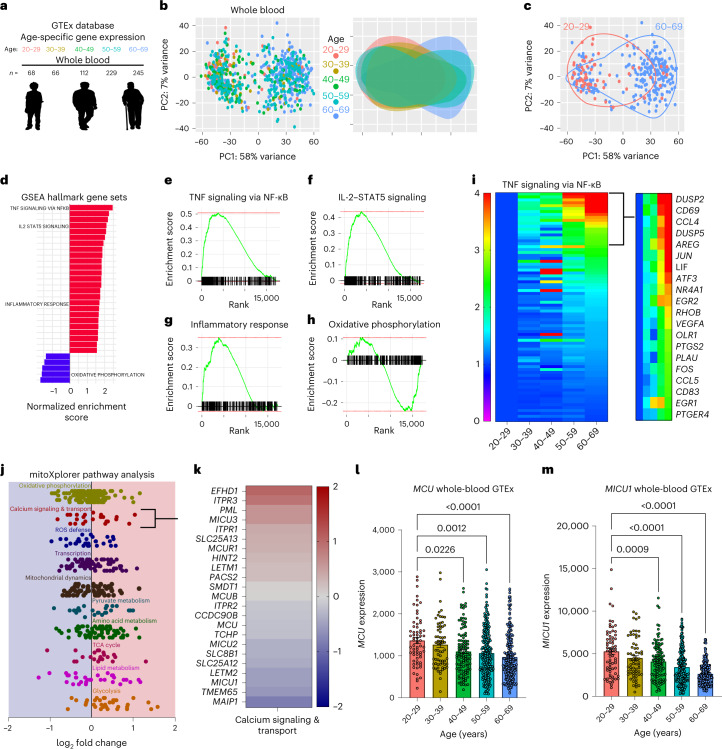
Fig. 1. Age-related changes in whole-blood gene expression are associated with increased inflammatory gene transcription and decreased expression of genes encoding mitochondrial Ca2+ transport.
a, GTEx database mined for tissue-specific gene expression across five indicated age groups; note the color coding for the age groups. b, Left, PCA of whole-blood gene expression from every sample, color coded according to the age groups. Right, the same data were used and color-coded clusters from each age group were overlaid. Note the variance in gene expression from different age groups. c, PCA plots from b were used to show only samples from the youngest and oldest age groups analyzed. d, Hallmark GSEA based on differential gene expression between the oldest (60–69 years) and youngest (20–29 years) datasets. Pathways were ranked by P value and plotted on the x axis by the normalized enrichment scores. e, GSEA of GSEA hallmark pathway, TNF signaling via NF-κB, based on differential gene expression of oldest (60–69 years) versus youngest (20–29 years) GTEx samples. Enrichment scores are plotted on the y axis and genes ranked in the ordered dataset are plotted on the x axis. f, GSEA of the IL-2–STAT5 GSEA hallmark pathway. g, GSEA of inflammatory response GSEA hallmark pathway. h, GSEA of the oxidative phosphorylation GSEA hallmark pathway. i, Heat map of expression levels of genes associated with the TNF–NF-κB pathway. Expression values were calculated as a fold change from the 20–29-year age group. j, mitoXplorer Pathway analysis based on DSeq2 analysis of oldest (60–69 years) versus youngest (20–29 years) GTEx samples. k, Individual genes in the calcium signaling and transport pathway were identified from mitoXplorer pathway analysis based on DSeq2 analysis of oldest (60–69 years) versus youngest (20–29 years) GTEx samples. Fold change was determined as a relative change in 60–69-year compared to 20–29-year GTEX samples. l, MCU gene counts for each sample in the GTEx database sorted by age. Error bars reflect the s.e.m.; P values were calculated using ordinary one-way analysis of variance (ANOVA). m, MICU1 gene counts for each sample in GTEx database sorted by age. Error bars reflect the s.e.m.; P values were calculated using ordinary one-way ANOVA.

