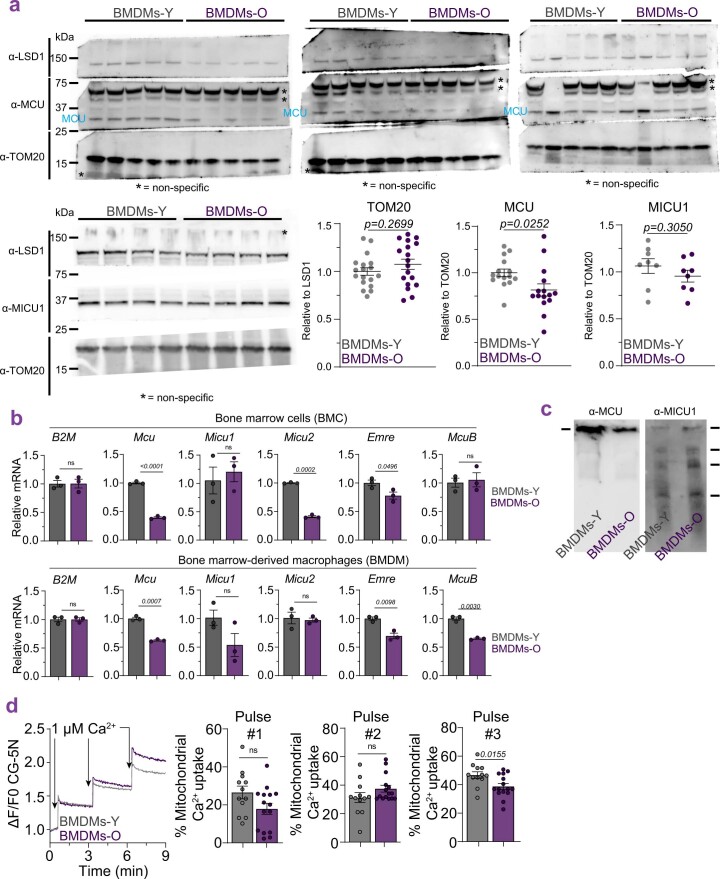
Extended Data Fig. 3. Expression of MCU components in BMDMs.
a. Western blot analysis of MCU, TOM20, and MICU1 protein. N = 5–15 mice, error bars reflect SEM; p-value determined by Welch’s t-test, two-tailed. b. Quantitative-PCR of Mcu and its regulatory subunits. N = 3 mice. Error bars reflect SEM; p-value determined by Welch’s t-test, two-tailed. c. Resolution of MCU complex in non-reducing conditions and immunoblotting for MCU and MICU1, N = 1 mouse. d. Pulsed mitochondrial Ca2+ uptake. N = 15 biological replicates.

