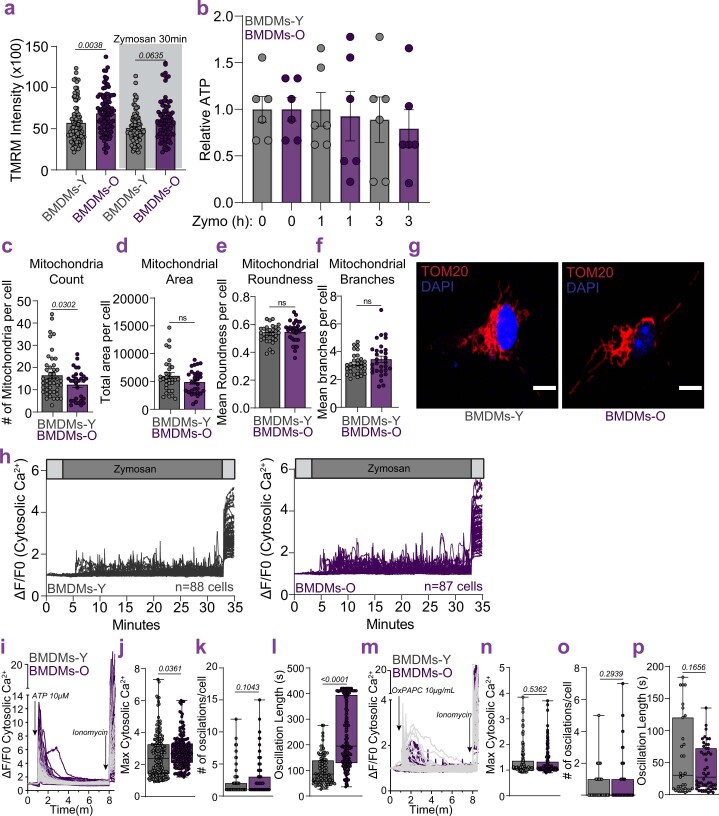
Extended Data Fig. 4. Analysis of mitochondria and Ca2+ responses in BMDMs.
a. Mitochondrial membrane potential. N = 90 cells, 3 independent experiments. Error bars reflect SEM; p-value determined by one-way ANOVA. b. Normalized luminescent measurements of ATP. N = 6 biological repeats. Error bars reflect SEM; p-value determined by one-way ANOVA. c. Mitochondrial counts. N = 30–45 cells, 3 independent experiments. Error bars reflect SEM; p-value significance according to Welch’s t-test, two-tailed. d. Mitochondrial area. N = 30–45 cells, 3 independent experiments. Error bars reflect SEM; not statistically significant according to Welch’s t-test, two-tailed. e. Mitochondrial roundness. N = 30–45 cells, 3 independent experiments. Error bars reflect SEM; not statistically significant according to Welch’s t-test, two-tailed. f. Mitochondrial branches. N = 30–45 cells, 3 independent experiments. Error bars reflect SEM; not statistically significant according to Welch’s t-test, two-tailed. g. Representative images of BMDMs-Y and BMDMs-O immunostained for TOM20. Scale bar at 10 µm. h. Cytosolic Ca2+ Oscillations in BMDMs-Y (n = 88 cells) and BMDMs-O (n = 87 cells). i. Cytosolic Ca2+ Oscillations with ATP. j. Maximum cytosolic Ca2+. N = 112 cells, 2 independent experiments. Whiskers represent the min to max values for each data set. Box represents 75th and 25th percentile. Line is at the median; p-value according to Welch’s t-test, two-tailed. k. Number of oscillations in individual cells. N = 112 cells, 2 independent experiments. Whiskers represent the min to max values for each data set. Box represents 75th and 25th percentile. Line is at the median; p<value according to Welch’s t-test, two-tailed. l. Oscillation length in individual cells. N = 112 cells, 2 independent experiments. Whiskers represent the min to max values for each data set. Box represents 75th and 25th percentile. Line is at the median; p<0.0001 according to Welch’s t-test, two-tailed. m. Cytosolic Ca2+ Oscillations with OxPAPC. n. Maximum cytosolic Ca2+. N = 104 cells, 2 independent experiments Whiskers represent the min to max values for each data set. Box represents 75th and 25th percentile. Line is at the median; p-value according to Welch’s t-test, two-tailed. o. Number of oscillations in individual cells. N = 104 cells, 2 independent experiments. Whiskers represent the min to max values for each data set. Box represents 75th and 25th percentile. Line is at the median; p<value according to Welch’s t-test, two-tailed. p. Oscillation length in individual cells. N = 104 cells, 2 independent experiments. Whiskers represent the min to max values for each data set. Line is at the median; p<0.0001 according to Welch’s t-test, two-tailed.

