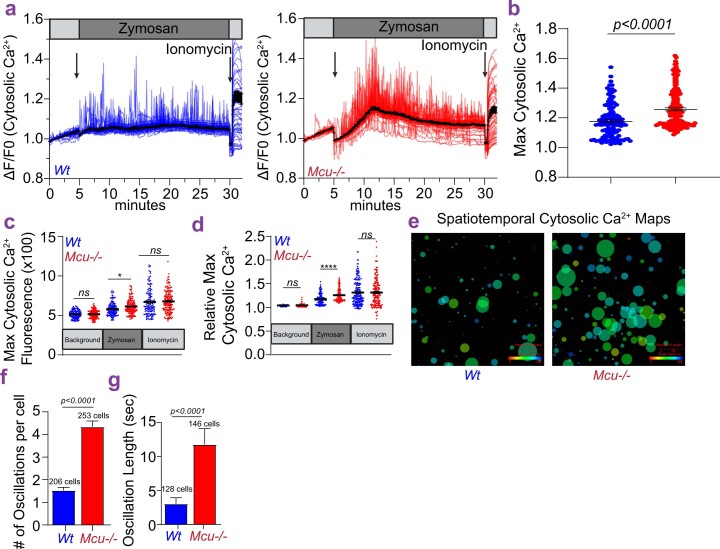
Extended Data Fig. 5. cCa2+ dynamics in Mcu−/− BMDMs-Y.
a. Cytosolic Ca2+ Oscillations in wt and Mcu−/− BMDMs. b. Maximum cytosolic Ca2+. N = 83 cells, 2 independent experiments. Error bars represent SEM; p<0.0001 according to Welch’s t-test, two-tailed. c. Maximum cytosolic Ca2+. N = 83 cells, 2 independent experiments. Error bars represent SEM; p<0.0001(****), p≤0.001(***), p≤0.01(**), p≤0.05(*) determined by the Brown-Forsythe and Welch ANOVA test. d. Maximum cytosolic Ca2+. N = 83 cells, 2 independent experiments. Error bars represent SEM of two independent experiments; p<0.0001(****), p≤0.001(***), p≤0.01(**), p≤0.05(*) determined by the Brown-Forsythe and Welch ANOVA test. e. CALIMA maps depicting spatiotemporal aspects of cytosolic Ca2+ elevations. f. Average number of oscillations per cell, seen during zymosan stimulation. N = 83 cells, 2 independent experiments Error bars represent SEM; p<0.0001 according to Welch’s t-test, two-tailed. g. Mean of oscillation lengths during zymosan stimulation. N = 83 cells, 2 independent experiments Error bars represent SEM; p<0.0001 according to Welch’s t-test, two-tailed.

