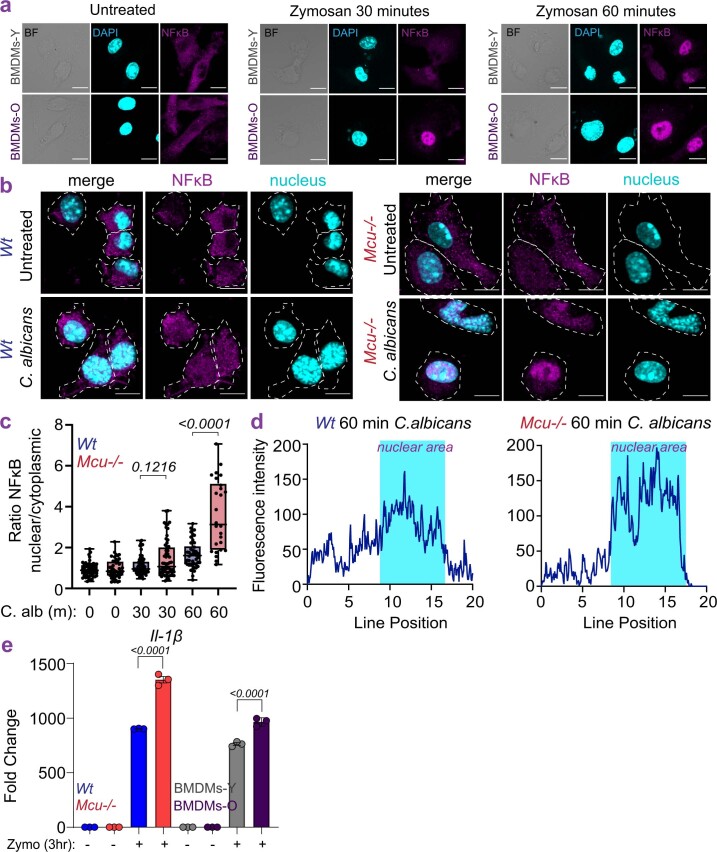
Extended Data Fig. 6. Analysis of NFkB translocation in response to C. albicans.
a. Representative images for data shown in Fig. 3g shown as single channels. b. Representative images from wt and Mcu−/− BMDMs, untreated or stimulated with C. albicans, for 30 or 60 minutes and immunostained for NFκB p65 subunit and nuclei (DAPI). The outline of cells was determined by bright field images. c. Nuclear to cytoplasmic ratios of the fluorescent intensity of NFκB for images shown in panel b. N = 30–72 cells, 2 independent experiments. Whiskers represent the min to max values for each data set. Box represents 75th and 25th percentile. Line is at the median; p-value according to one-way ANOVA. d. Representative analysis of fluorescent intensity of p65 staining along a line drawn across the cytoplasm and nucleus, as determined by DAPI staining (shaded blue). e. Zymosan-induced IL-1b expression (qPCR) in indicated BMDMs. N = 3 biological replicates. Error bars represent SEM, p-value calculated by one-way ANOVA.

