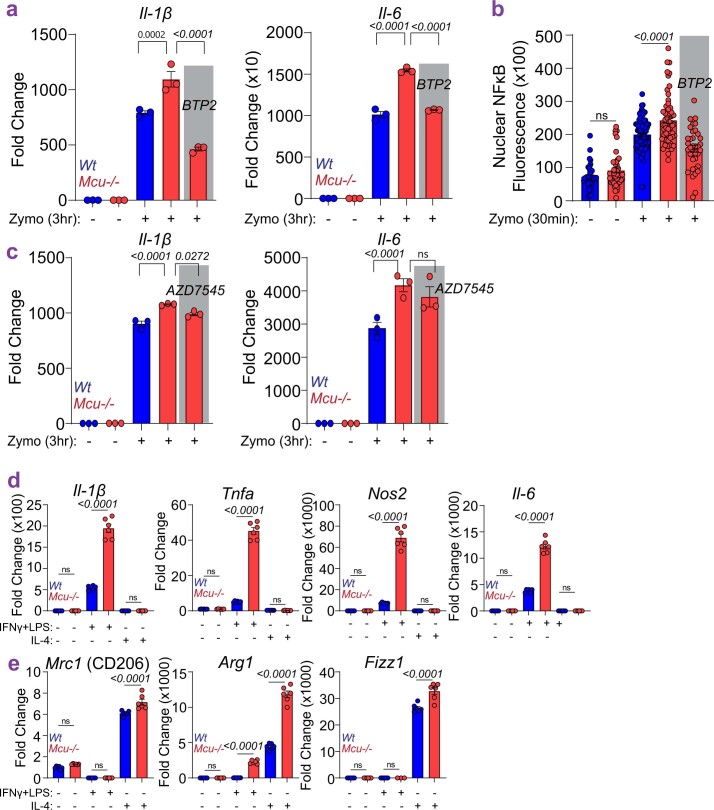
Extended Data Fig. 7. Effects of BTP2 and AZD7545 on inflammatory gene expression and analysis of macrophage activation.
a. Fold change expression of IL-1β and IL-6. N = 3 biological replicates. Error bars represent SEM; p-value determined by one-way ANOVA. b. Nuclear NFκB. N = 36–50 cells, 3 independent experiments. Error bars represent SEM; p-value determined by one-way ANOVA. c. Fold change expression of IL-1β and IL-6. N = 3 biological replicates. Error bars represent SEM; p-value determined by one-way ANOVA. d. Assessment of M1 polarization in wt and Mcu−/− BMDMs. N = 6 biological replicates. Error bars represent SEM; p-value determined by one-way ANOVA. e. Assessment of M2 polarization in wt and Mcu−/− BMDMs. N = 6 biological replicates. Error bars represent SEM; p-value determined by one-way ANOVA.

