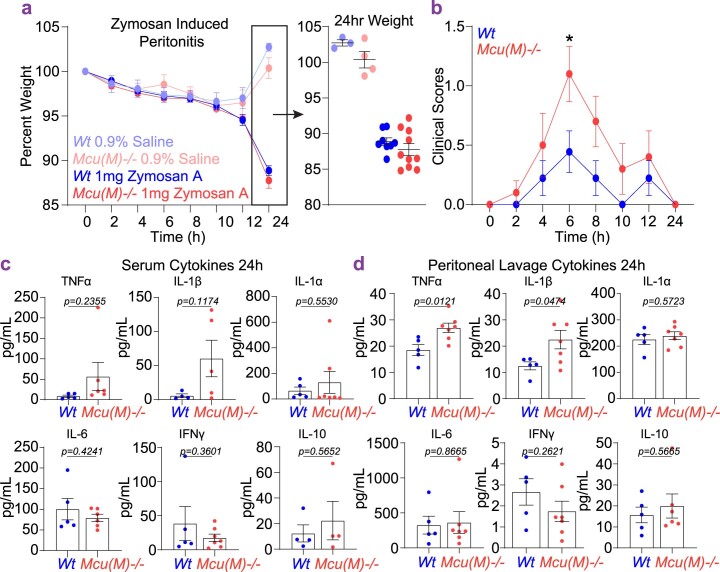
Extended Data Fig. 8. Zymosan induced peritonitis in mice wherein Mcu is deleted selectively in myeloid cells (Mcu(M)−/− mice).
a. Percent weight change for wt and Mcu(M)−/− mice in a model of Zymosan Induced Peritonitis. N = 9–10 mice. b. Clinical Scores for wt and Mcu(M)−/− mice in a model of Zymosan Induced Peritonitis. N = 9–10 mice. Error bars represent SEM; p≤0.05(*) determined by the one-way ANOVA. c. ELISA determined serum cytokines in wt and Mcu(M)−/− mice, at 24 hours, in a model of Zymosan Induced Peritonitis. N = 5 mice. Error bars represent SEM; p<0.0001 according to Welch’s t-test, two-tailed. d. Peritoneal lavage cytokines at 24 hours. N = 4–5 mice. Error bars represent SEM of two independent experiments: p-values according to Welch’s t-test, two-tailed.

