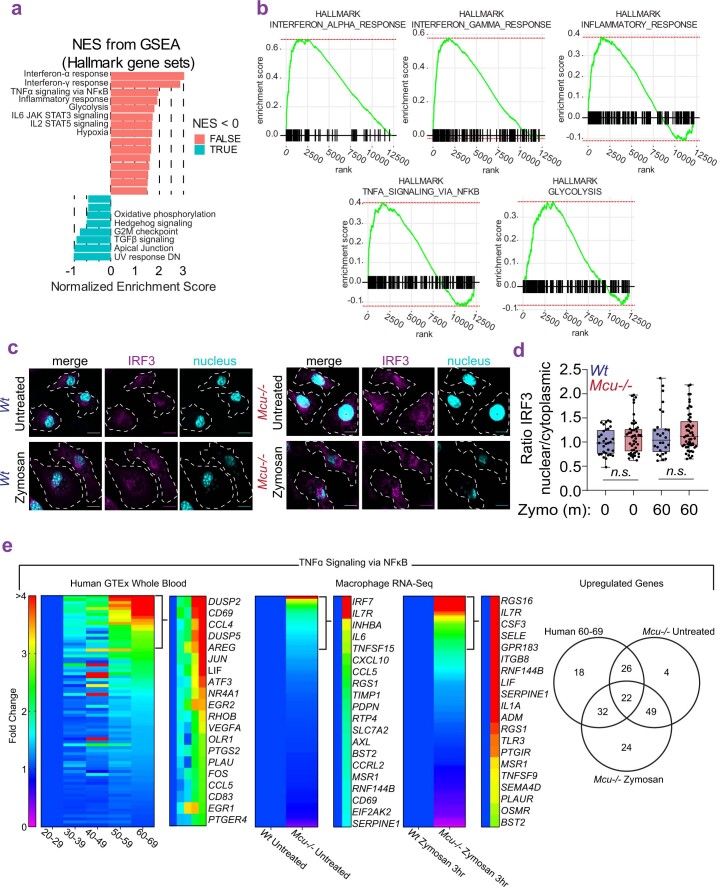
Extended Data Fig. 9. RNA-seq analysis of Mcu−/− macrophages and analysis of IRF3 translocation.
a. GSEA hallmark gene set enrichment analysis based on DSeq2 analysis of Mcu−/− versus wt BMDMs at baseline (untreated). b. Gene set enrichment analysis of GSEA pathways that are differentially expressed in Mcu−/− versus wt BMDMs at baseline (unstimulated). Enrichment scores (ES) are plotted on y-axis and genes ranked in ordered dataset are plotted in x-axis. c. Representative images from wt and Mcu−/− macrophages, untreated or stimulated with zymosan (30 min) and immunostained for IRF3 and nuclei (DAPI). Outline of cells was determined by bright field image. d. Quantified nuclear to cytoplasmic ratios of IRF3 fluorescence intensities in wt and Mcu−/− macrophages, unstimulated and zymosan-stimulated. N = 35–50 cells, 3 independent experiments. Box and whisker plot represents the min to max values for each data set. Line is at the median; p value calculated by one-way ANOVA test (found insignificant). e. Heatmaps show comparison of gene expression changes in the TNFα signaling via NFκB pathway from human and mice. Venn-diagram indicates similar genes upregulated in Human 60–69 compared to young Mcu−/− at baseline and following zymosan stimulation.

