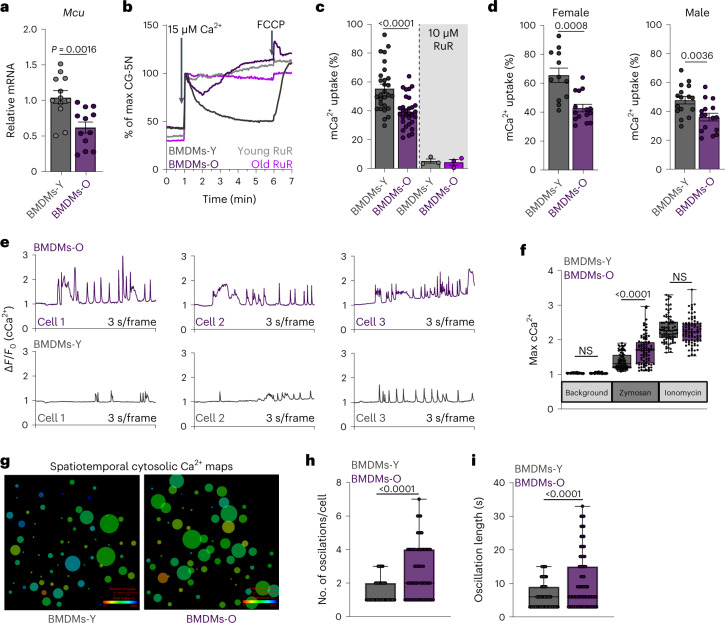
Fig. 2. Macrophages generated from aged mice display decreased mitochondrial Ca2+ uptake.
a, Mcu expression in BMDMs. N = 12 biological replicates, from four mice. Error bars reflect the s.e.m.; P = 0.0016 according to Welch’s t-test, two-tailed. b, Representative traces of mCa2+ uptake. c, Quantification of b. N = 28 biological replicates. Error bars reflect the s.e.m.; P values were calculated using ordinary one-way ANOVA. RuR, Ruthenium red. d, mCa2+ uptake data shown in c—segregated by sex. Error bars reflect the s.e.m.; P values were calculated using Welch’s t-test, two-tailed. e, Representative cCa2+ oscillations. f, Maximum cCa2+. N = 88 cells, three independent experiments. Whiskers represent the minimum to maximum values for each dataset. The box represents the 75th and 25th percentiles. The line is the median; P < 0.0001 according to one-way ANOVA. g, CALIMA spatiotemporal Ca2+ dynamics. h, Number of oscillations in individual cells. N = 88 cells, three independent experiments. Whiskers represent the minimum to maximum values for each dataset. The box represents the 75th and 25th percentiles. Line is at the median; P < 0.0001 according to Welch’s t-test, two-tailed. i, Oscillation length in individual cells. N = 88 cells, three independent experiments. Whiskers represent the minimum to maximum values for each dataset. The box represents the 75th and 25th percentiles. Line is at the median; P < 0.0001 according to Welch’s t-test, two-tailed. NS, not significant.

