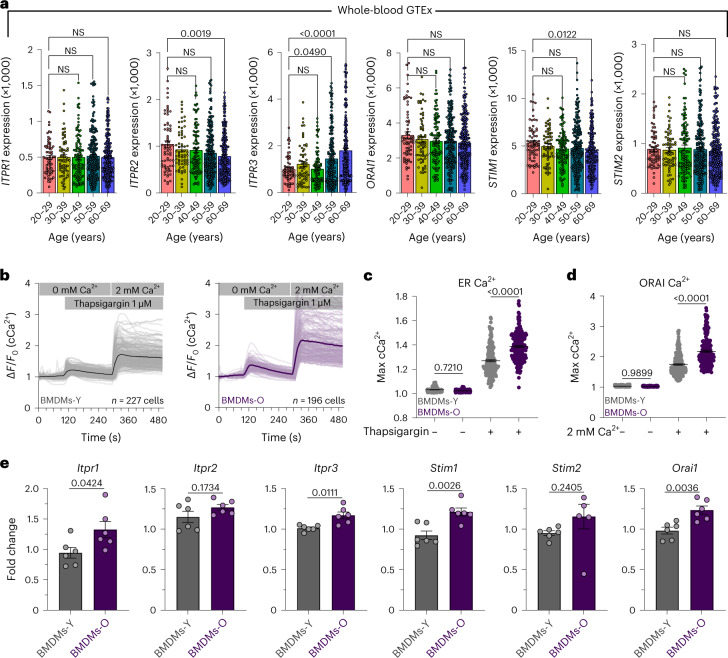
Fig. 3. Store-operated Ca2+ entry responses in macrophages generated from aged mice.
a, ITPR1, ITPR2, ITPR3, ORAI1, STIM1 and STIM2 gene counts for each sample in whole-blood GTEx database sorted by age. Error bars reflect the s.e.m.; P values were calculated using ordinary one-way ANOVA. b, Representative cCa2+ oscillations in BMDMs-Y and BMDMs-O. Bold lines indicated the mean of individual traces. c, Quantification of ER Ca2+. N = 150 cells, three independent experiments. Error bars represent the s.e.m.; P values were determined by one-way ANOVA. d, Quantification of ORAI Ca2+. N = 150 cells, three independent experiments. Error bars represent the s.e.m.; P value determined by one-way ANOVA. e, Fold change expression at baseline for SOCE genes. N = 6 biological replicates, two independent experiments. Error bars represent the s.e.m.; P value determined by Welch’s t-test, two-tailed.

