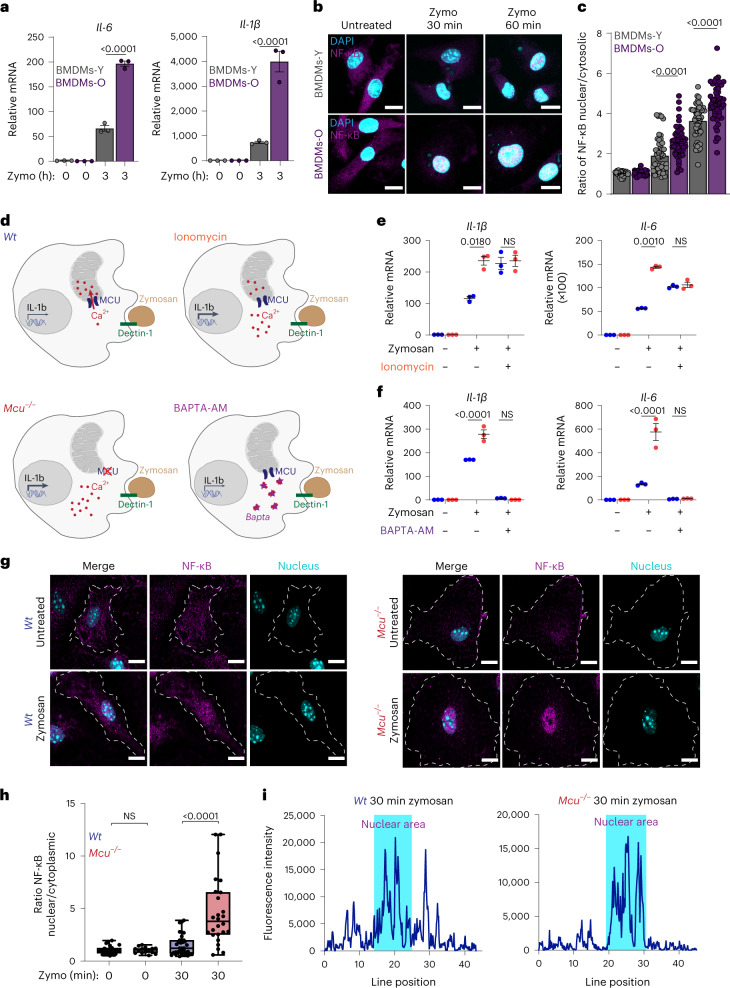
Fig. 5. Mitochondrial Ca2+ uptake buffers cytosolic Ca2+ to control inflammatory output in macrophages.
a, IL-6 and IL-1β mRNA expression from indicated BMDMs. Representative experiment, from two independent experiments. Error bars represent the s.e.m.; P < 0.0001 according to one-way ANOVA. b, Representative images from indicated BMDMs stimulated with zymosan for 30 and 60 min. Magenta shows immunostaining of NF-κB p65 subunit; cyan shows DAPI staining of nuclei. c, Nuclear to cytoplasmic ratios of the fluorescence intensity of NF-κB. N = 45 cells, three independent experiments. Bars reflect means of ratios; P values were determined by one-way ANOVA. d, Model depicting how mCa2+ uptake affects cCa2+ and inflammatory gene expression in response to zymosan. e, Effect of ionomycin on IL-1β and IL-6 mRNA expression in WT and Mcu−/− macrophages. Representative experiment, from two independent experiments. Error bars represent the s.e.m.; P values were determined by two-way ANOVA. f, Effect of BAPTA-AM on IL-1β and IL-6 expression in WT and Mcu−/− macrophages. Representative experiment, from two independent experiments. Error bars represent the s.e.m.; P value determined by two-way ANOVA. g, Representative images from WT and Mcu−/− macrophages, untreated or stimulated with zymosan for 30 min and immunostained for NF-κB p65 subunit and nuclei (DAPI). h, Nuclear to cytoplasmic ratios of the fluorescence intensity of NF-κB. N = 25 cells, from three independent experiments. Whiskers represent the minimum to maximum values for each dataset. The box represents the 75th and 25th percentiles. The line is the median; P < 0.0001 according to one-way ANOVA. i, Representative analysis of fluorescence intensity of p65 staining along a line drawn across the cytoplasm and nucleus (DAPI staining), which is shaded blue.

